部署 Istio
参考 文档 部署 Istio 集群,如下所示:
➜  istio-1.16.5 kubectl -n istio-system get pod
NAME                                     READY   STATUS    RESTARTS   AGE
istio-eastwestgateway-64fd87c956-8nlpg   1/1     Running   0          29h
istiod-66c5ff9789-bsc75                  1/1     Running   0          29h
部署 Prometheus 与 Grafana
参考 文档 部署 Prometheus,参考 文档 部署 Grafana,Prometheus 如下所示:
kubectl -n istio-system port-forward --address 0.0.0.0 pod/prometheus-85674d4cb8-f7q2l 9090:9090
http://localhost:9090/graph
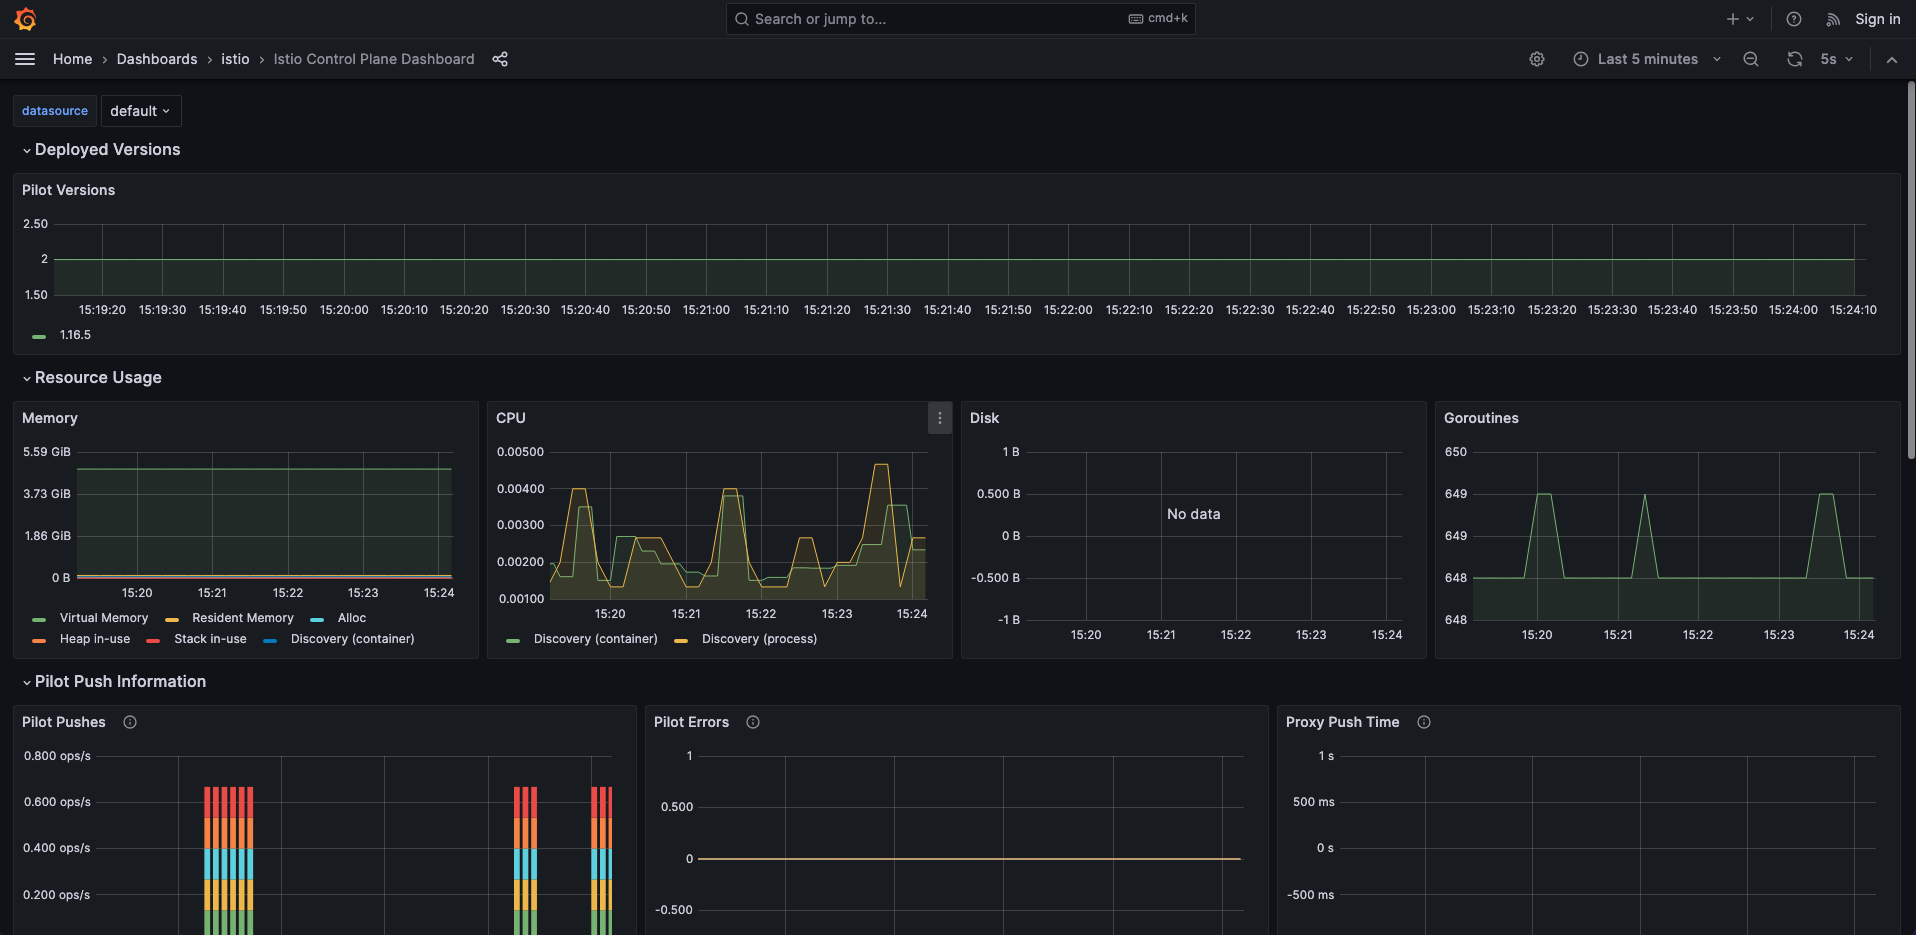
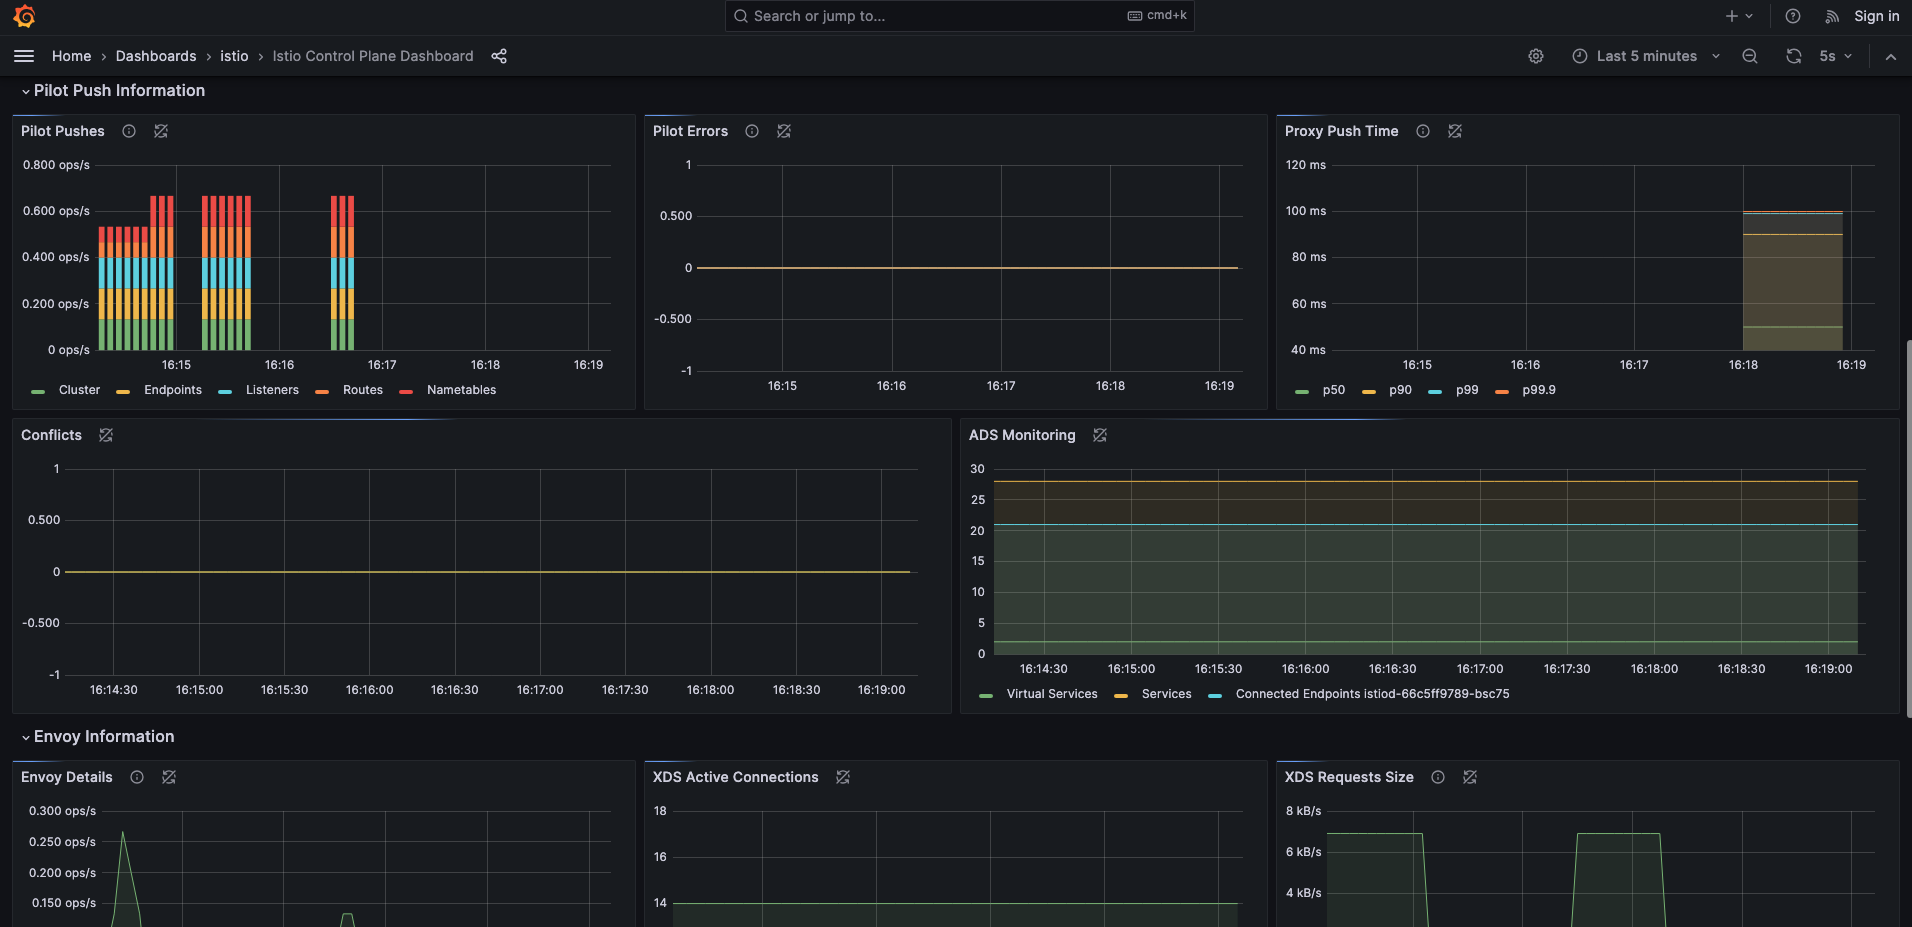
Grafana 如下所示:
kubectl -n istio-system port-forward --address 0.0.0.0 pod/grafana-8cb9f8f79-5b42p   3000:3000

http://localhost:3000
➜  istio-1.16.5 kubectl -n istio-system get pod
NAME                                     READY   STATUS    RESTARTS   AGE
grafana-8cb9f8f79-5b42p                  1/1     Running   0          2d2h
istio-eastwestgateway-64fd87c956-8nlpg   1/1     Running   0          3d4h
istiod-66c5ff9789-bsc75                  1/1     Running   0          3d4h
prometheus-85674d4cb8-f7q2l              2/2     Running   0          3d3h
自定义指标
如果我们需要自定义遥测 telemetry v2 指标,比如将 request_host 和 destination_port 维度添加到 gateway 和 sidecar 在 inbound 和 outbound 暴露的 requests_total 指标,请使用以下命令。
cat <<EOF > ./custom_metrics.yaml
apiVersion: telemetry.istio.io/v1alpha1
kind: Telemetry
metadata:
  name: namespace-metrics
spec:
  metrics:
  - providers:
    - name: prometheus
    overrides:
    - match:
        metric: REQUEST_COUNT
      tagOverrides:
        destination_port:
          value: "string(destination.port)"
        request_host:
          value: "request.host"
EOF
kubectl apply -f custom_metrics.yaml
productpage-v1-66756cddfd-hl9df 的 access_log 日志如下所示:
{
	"protocol": "HTTP/1.1",
	"upstream_host": "172.16.0.20:9080",
	"upstream_service_time": "1",
	"upstream_cluster": "inbound|9080||",
	"downstream_remote_address": "172.16.0.44:47564",
	"requested_server_name": null,
	"bytes_sent": 0,
	"response_code_details": "via_upstream",
	"method": "HEAD",
	"x_forwarded_for": null,
	"route_name": "default",
	"duration": 2,
	"response_flags": "-",
	"user_agent": "curl/7.81.0",
	"upstream_local_address": "127.0.0.6:38005",
	"bytes_received": 0,
	"start_time": "2023-12-15T11:53:34.218Z",
	"upstream_transport_failure_reason": null,
	"request_id": "af309304-4b56-43e1-9b33-02a5faa9bdd3",
	"path": "/",
	"downstream_local_address": "172.16.0.20:9080",
	"connection_termination_details": null,
	"response_code": 200,
	"authority": "productpage:9080"
}
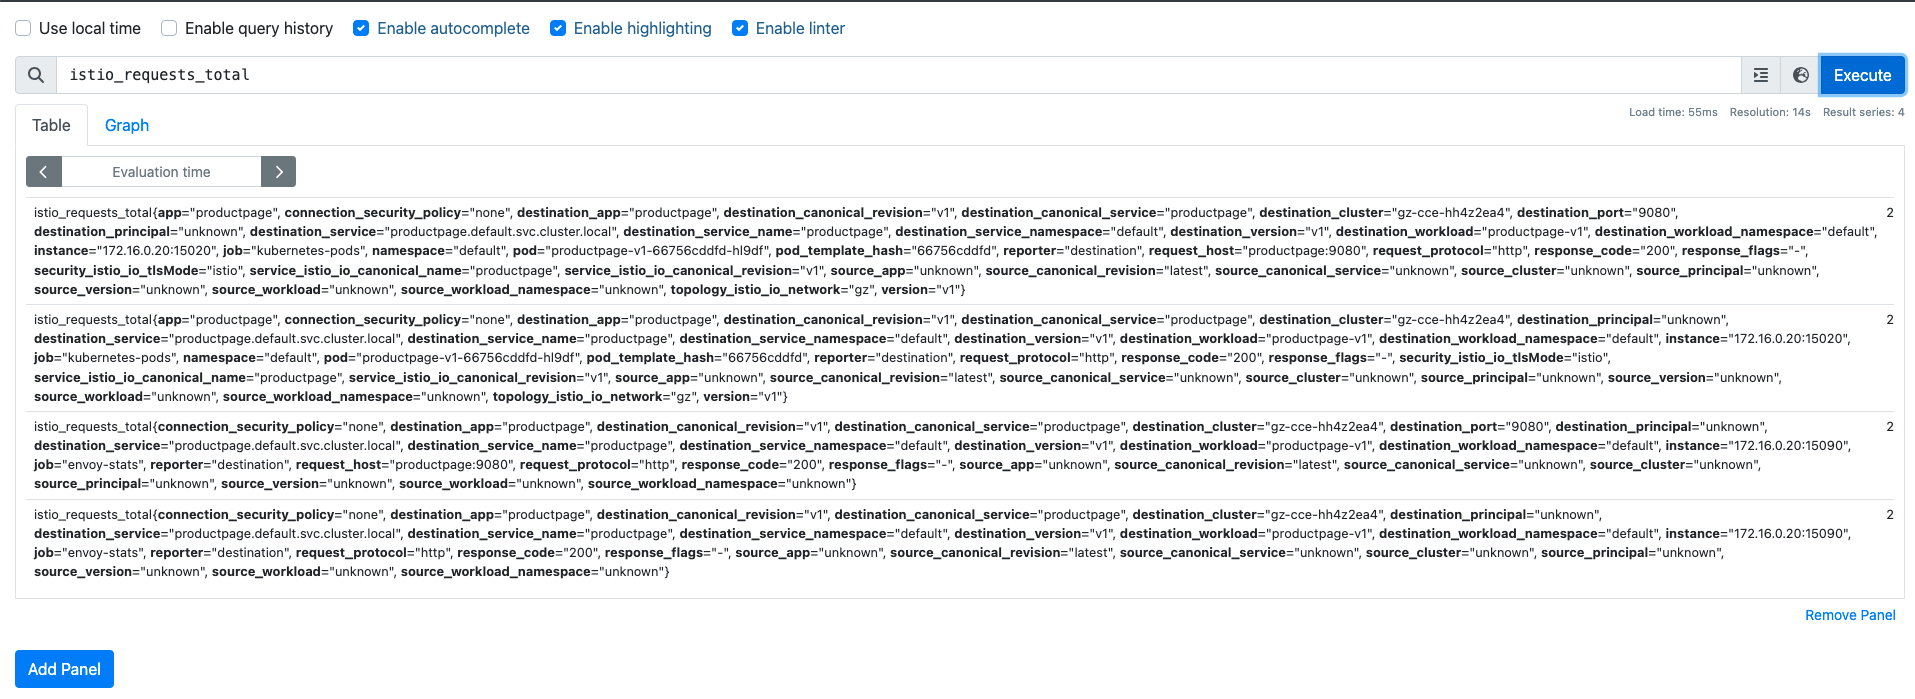
Prometheus 中的 productpage 指标如下所示,其中 request_host=“productpage:9080” 就是我们自定义的 metric 指标。
istio_requests_total{app="productpage", connection_security_policy="none", destination_app="productpage", destination_canonical_revision="v1", destination_canonical_service="productpage", destination_cluster="gz-cce-hh4z2ea2", destination_port="9080", destination_principal="unknown", destination_service="productpage.default.svc.cluster.local", destination_service_name="productpage", destination_service_namespace="default", destination_version="v1", destination_workload="productpage-v1", destination_workload_namespace="default", instance="172.16.0.20:15020", job="kubernetes-pods", namespace="default", pod="productpage-v1-66756cddfd-hl9df", pod_template_hash="66756cddfd", reporter="destination", request_host="productpage:9080", request_protocol="http", response_code="200", response_flags="-", security_istio_io_tlsMode="istio", service_istio_io_canonical_name="productpage", service_istio_io_canonical_revision="v1", source_app="unknown", source_canonical_revision="latest", source_canonical_service="unknown", source_cluster="unknown", source_principal="unknown", source_version="unknown", source_workload="unknown", source_workload_namespace="unknown", topology_istio_io_network="gz", version="v1"}
标签(Labels)
指标中包含的标签,可以用来过滤和聚合数据,具体如下:
- 报告者(Reporter):标识了请求的报告者,如果报告来自服务器 Istio 代理,则将其设置为 destination,如果报告来自客户端 Istio 代理或网关,则将其设置为 source。
- 源工作负载(Source Workload):标识了控制源的源工作负载的名称,如果源信息丢失,则为 unknown。
- 源工作负载命名空间(Source Workload Namespace):标识源工作负载的命名空间,如果源信息丢失,则为 unknown。
- 源主体(Source Principal):标识流量源的对等主体,当使用对等认证时设置。
- 源应用程序(Source App):根据源工作负载的应用程序 app 标签来标识源应用程序,或者如果源信息丢失则为 unknown。
- 源版本(Source Version):标识源工作负载的版本,如果源信息丢失,则为 unknown。
- 目标工作负载(Destination Workload):标识目标工作负载的名称,如果目标信息丢失,则为 unknown。
- 目标工作负载命名空间(Destination Workload Namespace):标识目标工作负载的命名空间,如果目标信息丢失,则为 unknown。
- 目标主体(Destination Principal):标识流量目标的对等主体,当使用对等认证时设置。
- 目标应用程序(Destination App):根据目标工作负载的应用程序 app 标签来标识目标应用程序,或者如果目标信息丢失则为 unknown。
- 目标版本(Destination Version):这标识了目标工作负载的版本,或者如果目标信息丢失则为 unknown。
- 目标服务(Destination Service):这标识负责传入请求的目标服务主机,比如:details.default.svc.cluster.local。
- 目标服务名称(Destination Service Name):这标识了目标服务名称,例如:details。
- 目标服务命名空间(Destination Service Namespace):标识目标服务的命名空间。
- 请求协议(Request Protocol):标识请求的协议,它设置为请求或连接协议。
- 响应码(Response Code):标识请求的响应码,此标签仅出现在 HTTP 指标上。
- 连接安全策略(Connection Security Policy):标识请求的服务认证策略,当使用 Istio 确保通信安全并且报告来自目标时,它设置为 mutual_tls。当报告来自源时,它被设置为 unknown,因为无法正确填充安全策略。
- 响应标志(Response Flags):有关来自代理的响应或连接的其他详细信息。如果是 Envoy,请参阅 Envoy 访问日志中的 %RESPONSE_FLAGS% 了解更多详细信息,见access_log。
- 规范服务(Canonical Service):一个工作负载只属于一个规范服务,但它可以属于多个服务。规范服务具有名称和修订版本,因此会产生以下标签,如
source_canonical_service、source_canonical_revision、destination_canonical_service、destination_canonical_revision等。 - 目标集群(Destination Cluster):标识目标工作负载的集群,这是在集群安装时通过 global.multiCluster.clusterName 设置的。
- 源集群(Source Cluster):标识源工作负载的集群,这是在集群安装时通过 global.multiCluster.clusterName 设置的。
- gRPC 响应状态(gRPC Response Status):标识 gRPC 的响应状态,此标签仅出现在 gRPC 指标上。
指标(Metrics)
Istio 封装 Envoy 所有的指标,可参考 envoy-attributes,Envoy 元数据对于 outbound 的 upstream_peer 与 inbound 的 downstream_peer 具备如下的字段:
| Field | Type | Value |
|---|---|---|
| name | string | Name of the pod. |
| namespace | string | Namespace that the pod runs in. |
| labels | map | Workload labels. |
| owner | string | Workload owner. |
| workload_name | string | Workload name. |
| platform_metadata | map | Platform metadata with prefixed keys. |
| istio_version | string | Version identifier for the proxy. |
| mesh_id | string | Unique identifier for the mesh. |
| app_containers | list | List of short names for application containers. |
| cluster_id | string | Identifier for the cluster to which this workload belongs. |
遥测 telemetry 组件是代理 扩展实现。COUNTER 是一个严格递增的整数,DISTRIBUTION 将值范围映射到频率。COUNTER 和 DISTRIBUTION 对应 Envoy 文档 中的指标计数器和直方图。
对于 HTTP、HTTP/2 和 GRPC 流量,Istio 有以下指标:
- 请求计数 (istio_requests_total):Istio 代理处理的每个请求递增的计数器。
- 请求持续时间(istio_request_duration_milliseconds):测量请求持续时间的分布。
- 请求大小 (istio_request_bytes):测量 HTTP 请求正文大小的分布。
- 响应大小 (istio_response_bytes):测量 HTTP 响应正文大小的分布。
- gRPC 请求消息计数 (istio_request_messages_total):针对从客户端发送的每条 gRPC 消息而递增的计数器。
- gRPC 响应消息计数 (istio_response_messages_total):针对从服务器发送的每条 gRPC 消息而递增的计数器。
对于 TCP 流量,Istio 有以下指标:
- 发送的 Tcp 字节数 (istio_tcp_sent_bytes_total):测量 TCP 连接时响应期间发送的总字节数。
- 接收的 Tcp 字节数 (istio_tcp_received_bytes_total):测量 TCP 连接时请求期间接收到的总字节数。
- 打开的 Tcp 连接数 (istio_tcp_connections_opened_total):针对每个打开的连接递增的计数器。
- 关闭的 Tcp 连接数 (istio_tcp_connections_angled_total):针对每个关闭的连接递增的计数器。
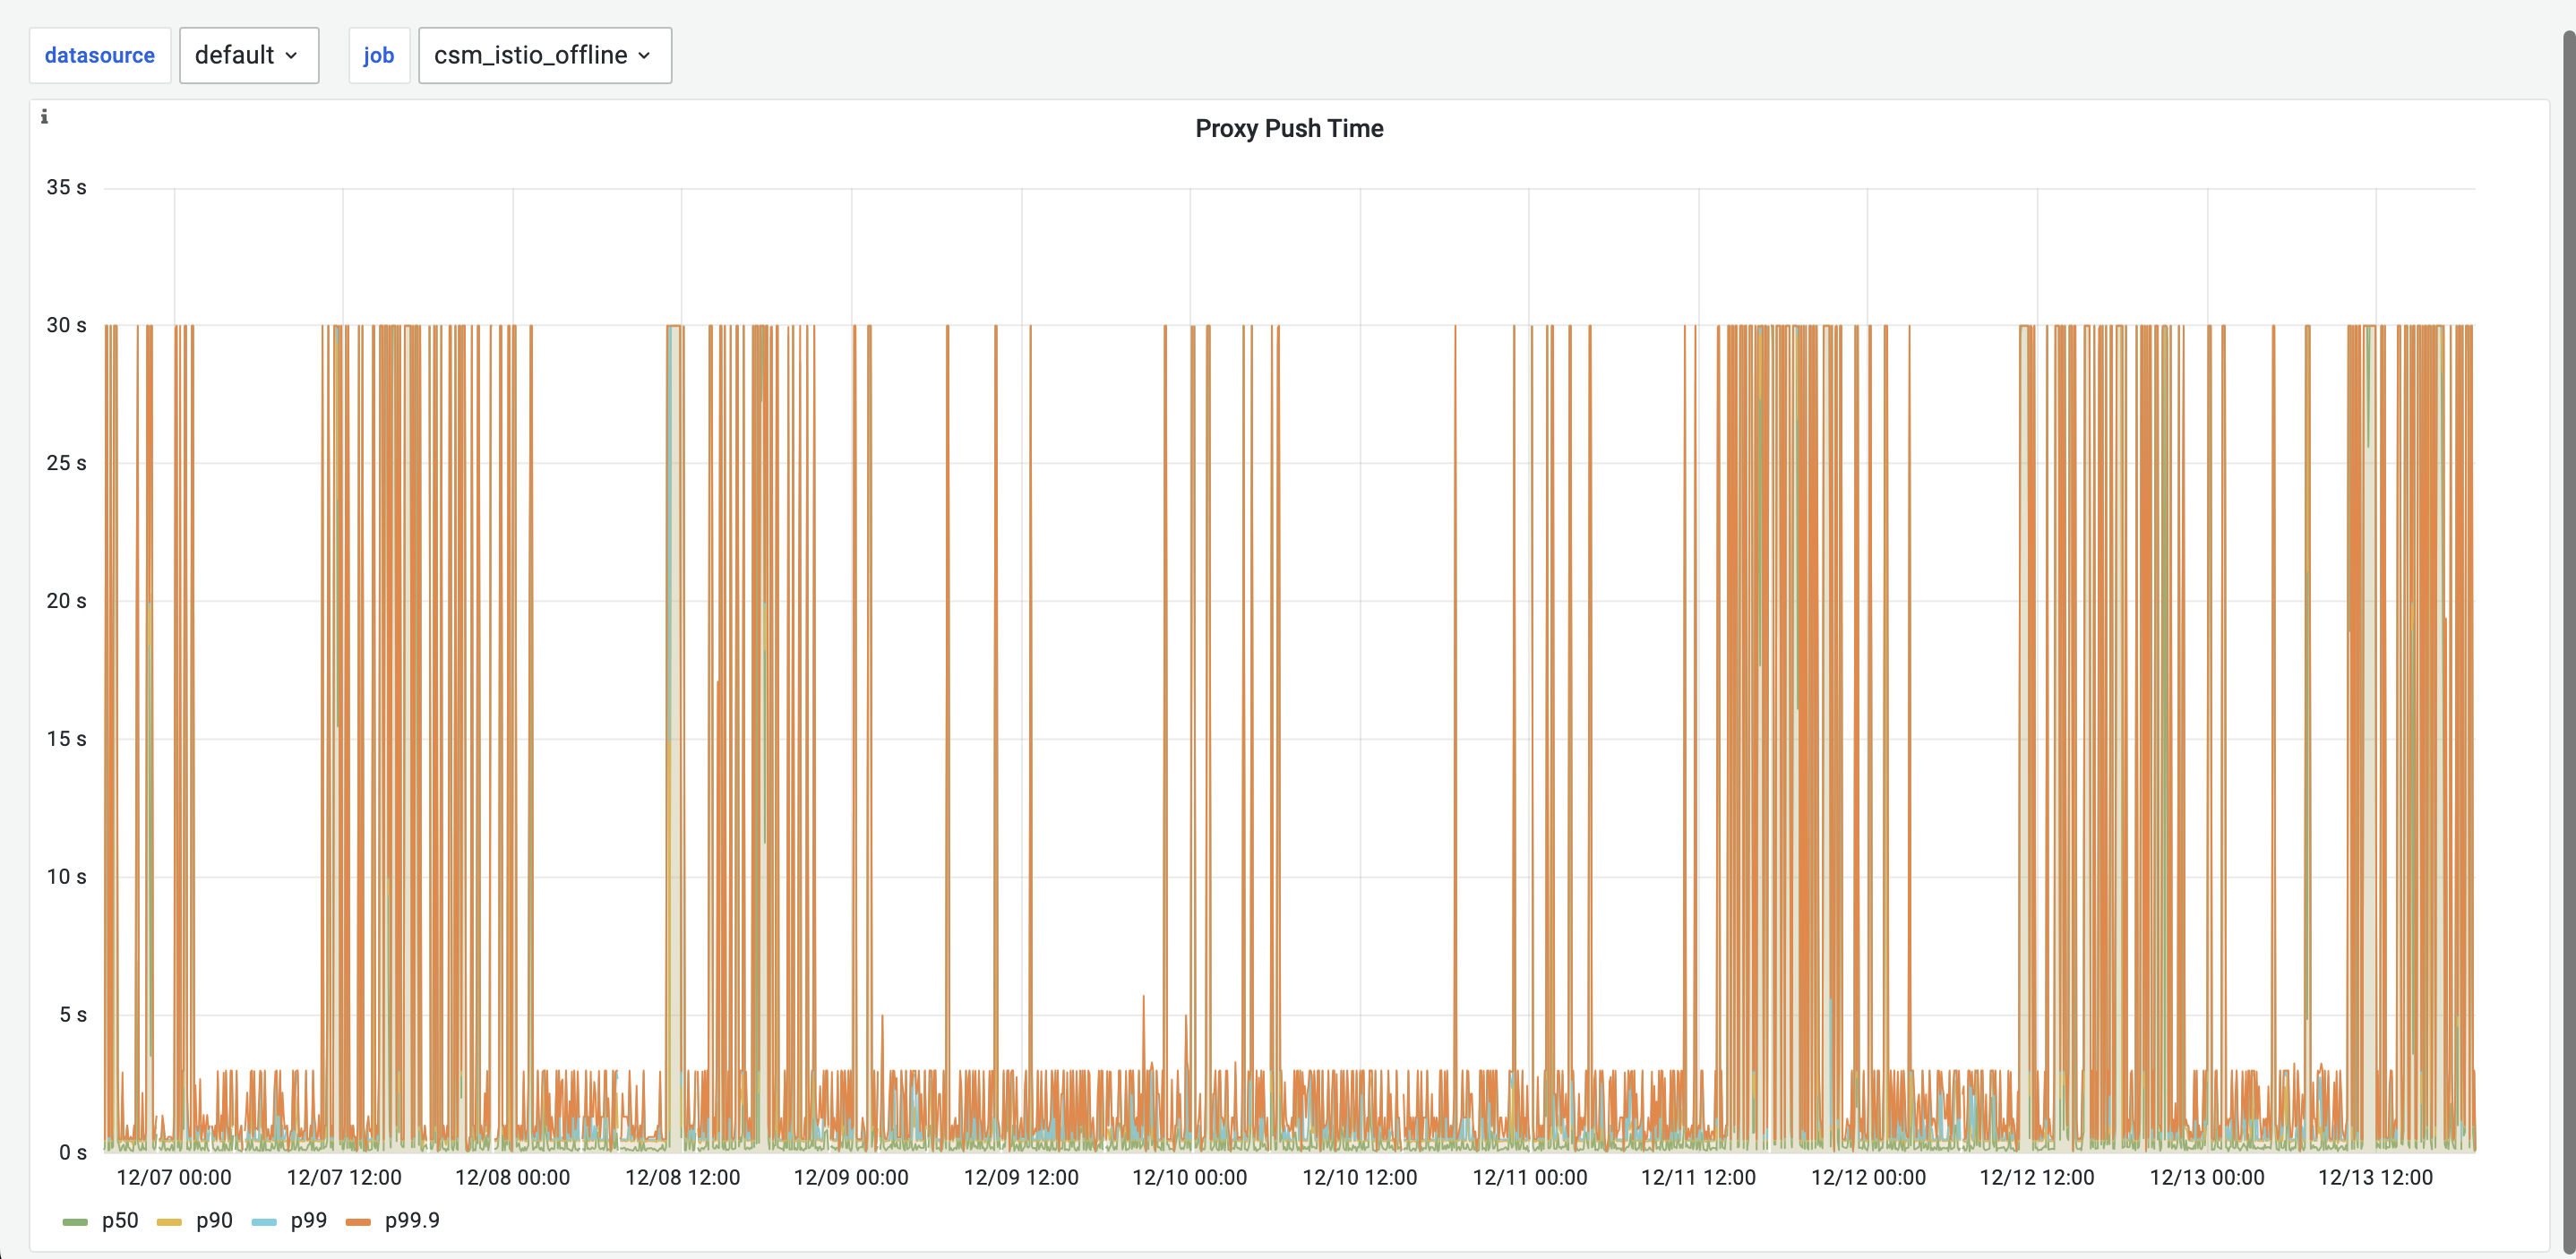
性能指标
经过测试,发现 istio 1.13.2 版本在 kubernetes 集群(service 1300+、CRD 1000+、Pod 1200+)规模下,Istiod 的 Proxy Push Time(pilot_proxy_convergence_time_bucket) 指标推送时长持续上升,p99 达到 30s+,如下所示:
控制平面
以下是 Istio 1.16.5 版本为基础梳理的控制平面与数据平面核心指标。
| 名称 | 描述 |
|---|---|
| istiod_running_status | istiod 运行状态异常 |
| istiod_mem_usage_rate | istiod 内存使用率 |
| istiod_cpu_usage_rate | istiod CPU 使用率 |
| controller_sync_errors_total | istiod controller 启动失败次数 |
| istio_agent_num_outgoing_retries | istio-agent 携带 k8s jwt token 访问 istiod 获取证书,如果 jwt 验证失败,该指标会增加 |
| pilot_eds_no_instances | 没有 ep 的服务数量 |
| pilot_vservice_dup_domain | 具有相同 host 的 VirtualService 数量 |
| pilot_total_rejected_configs | 被拒绝或忽略的配置总数 |
| pilot_envoy_filter_status | envoyfilter 状态 |
| pilot_jwks_resolver_network_fetch_fail_total | Pilot 引导 jwks 解析器获取网络失败的总数 |
| pilot_total_xds_rejects | Pilot 被代理拒绝响应的 XDS 总数 |
| pilot_xds_delayed_pushes_total | 延迟的 XDS 推送总数 |
| pilot_xds_write_timeout | Pilot 响应 XDS 超时次数 |
| pilot_xds_pushes | Pilot 创建和下发 XDS 配置次数 |
| pilot_xds_push_context_errors | pushContext 初始化失败次数 |
| pilot_sds_certificate_errors_total | 获取 SDS 密钥和证书失败的总数 |
| pilot_total_xds_internal_errors | istiod 内部错误次数 |
| citadel_server_root_cert_expiry_timestamp | Citadel root 证书将过期的 Unix 时间戳(秒) |
| citadel_server_cert_chain_expiry_timestamp | Citadel 证书链到期时间戳(秒) |
| citadel_server_authentication_failure_count | 身份验证失败的次数 |
| citadel_server_csr_parsing_err_count | Citadel 分析 CSR 时发生的错误数 |
| citadel_server_id_extraction_err_count | Citadel 从 CSR 提取 ID 时发生的错误数 |
| citadel_server_csr_sign_err_count | Citadel 签署 CSR 时发生的错误数 |
| sidecar_injection_failure_total | sidecar 注入失败的请求总数 |
| wasm_config_conversion_duration | wasm 加载时长 |
| istio_agent_cert_expiry_seconds | 证书到期前剩余的时间(秒) |
| per_istiod_jobup_status | istiod抓取任务是否启动 |
数据平面
| 名称 | 描述 |
|---|---|
| per_sidecar_config_conflict_status | sidecar 配置冲突 |
| per_sidecar_running_status | sidecar 运行状态异常 |
| per_sidecar_mem_usage_rate | sidecar 内存使用率 |
| per_sidecar_cpu_usage_rate | sidecar CPU 使用率 |
| instance_realtime_qps | 集群实时 QPS |
| istio_requests_total | 集群成功率(非5xx) |
| istio_request_duration_milliseconds_bucket | 延时(90分位,95分位,99分位) |
| istiod_connection_failures | 连接到 Istio 控制面失败总数 |
| istiod_connection_terminations | 连接到 Istiod 错误总数 |
| envoy_connection_terminations | Envoy 连接错误的总数 |
| webhook_patch_retries_total | Webhook patch 重试次数 |
| webhook_patch_failures_total | Webhook patch 失败的次数 |
| envoy_cluster_bind_errors | Envoy 绑定 cluster 错误次数 |
| envoy_cluster_http2_rx_messaging_error | 违反 HTTP/2 规范第 8 节的无效接收帧总数 |
| webhook_cert_consistent_status | Webhook 证书是否正确 |
| per_sidecar_istiod_connection_status | sidecar 与 istiod 连接状态是否正常 |
| istio_agent_startup_duration_seconds | sidecar 启动时长 |
| envoy_cluster_http2_stream_refused_errors | Envoy 拒绝错误次数 |
其他指标
我们可以在 istiod 与 istio-proxy Pod 中使用 http://localhost:port/metrics 查看其他指标,控制平面指标如下所示:
| 指标名称 | 指标类型 | 指标说明 |
|---|---|---|
| auto_registration_deletes_total | Sum | 定期计时器清理的自动注册总数 |
| auto_registration_errors_total | Sum | 自动注册出现错误的总数 |
| auto_registration_success_total | Sum | 成功自动注册的总数 |
| auto_registration_unregister_total | Sum | 注销的总数 |
| auto_registration_updates_total | Sum | 自动注册更新的总数 |
| citadel_server_authentication_failure_count | Sum | 身份验证失败的次数 |
| citadel_server_cert_chain_expiry_timestamp | LastValue | Citadel 证书链到期时间戳(秒),负数时间表示证书已过期 |
| citadel_server_csr_count | Sum | Citadel 接收的 CSR 计数 |
| citadel_server_csr_parsing_err_count | Sum | Citadel 分析 CSR 时发生的错误数 |
| citadel_server_csr_sign_err_count | Sum | Citadel 签署 CSR 时发生的错误数 |
| citadel_server_id_extraction_err_count | Sum | Citadel 从 CSR 提取ID时发生的错误数 |
| citadel_server_root_cert_expiry_timestamp | LastValue | Citadel 根证书将过期的时间戳(秒)。负时间表示证书已过期 |
| citadel_server_success_cert_issuance_count | Sum | 已成功颁发的证书数 |
| controller_sync_errors_total | Sum | errorMetric 同步控制器的总数 |
| endpoint_no_pod | LastValue | Endpoint 没有关联任何 pod |
| galley_validation_config_delete_error | Count | Galley 验证 k8s webhook 配置删除错误 |
| galley_validation_config_load | Count | Galley 验证 k8s webhook 配置(重新)加载 |
| galley_validation_config_load_error | Count | Galley 验证 k8s webhook 配置(重新)加载错误 |
| galley_validation_config_update_error | Count | Galley 验证 k8s webhook配置更新错误 |
| galley_validation_config_updates | Count | Galley 验证 k8s webhook配置更新 |
| galley_validation_failed | Sum | Galley 资源验证失败 |
| galley_validation_http_error | Sum | Galley 验证 http 服务错误 |
| galley_validation_passed | Sum | Galley 验证通过,资源有效 |
| istio_build | LastValue | IIstio 组件构成信息 |
| istiod_managed_clusters | LastValue | 控制面管理的集群数 |
| num_outgoing_retries | Sum | 传出的重试请求总数 |
| pilot_conflict_inbound_listener | LastValue | inbound listeners 冲突的次数 |
| pilot_conflict_outbound_listener_http_over_current_tcp | LastValue | 与当前 outbound TCP Listener 冲突的 HTTP Listener 总数 |
| pilot_conflict_outbound_listener_tcp_over_current_http | LastValue | 与当前 outbound 的 HTTP Listener 冲突的 TCP Listener 总数 |
| pilot_conflict_outbound_listener_tcp_over_current_tcp | LastValue | 与当前 outbound 的 TCP Listener 冲突的 TCP Listener 总数 |
| pilot_destrule_subsets | LastValue | DestinationRules 中关于同一服务的子集配置重复 |
| pilot_duplicate_envoy_clusters | LastValue | 具有相同主机名的 ServiceEntriy 导致 Envoy 集群重复 |
| pilot_eds_no_instances | LastValue | 没有任何实例的集群数 |
| pilot_endpoint_not_ready | LastValue | Endpoint 处于未就绪状态 |
| pilot_inbound_updates | Sum | Pilot 接收到 inbound 的更新的总数 |
| pilot_jwks_resolver_network_fetch_fail_total | Sum | Pilot 引导 jwks 解析器获取网络失败的总数 |
| pilot_jwks_resolver_network_fetch_success_total | Sum | Pilot 引导 jwks 解析器获取网络成功的总数 |
| pilot_k8s_cfg_events | Sum | K8s 配置中发生的事件 |
| pilot_k8s_endpoints_pending_pod | LastValue | 当前没有任何 pod 关联的 Endpoint 的数量 |
| pilot_k8s_endpoints_with_no_pods | Sum | 没有关联任何 pod 的 Endpoint |
| pilot_k8s_reg_events | Sum | k8s注册表中的事件 |
| pilot_no_ip | LastValue | 在 Endpoint 表中找不到 Pod |
| pilot_proxy_convergence_time | Distribution | 配置更改和代理接收所有必需配置之间的延迟(秒) |
| pilot_proxy_queue_time | Distribution | 代理在退出队列之前处于推送队列中的时间(秒) |
| pilot_push_triggers | Sum | 触发推送的总次数,按推送原因标记 |
| pilot_pushcontext_init_seconds | Distribution | Pilot 初始化 pushContext 所需的总时间(秒) |
| pilot_sds_certificate_errors_total | Sum | 获取 SDS 密钥和证书失败的总数 |
| pilot_services | LastValue | Pilot 已知的服务数 |
| pilot_total_rejected_configs | Sum | Pilot 拒绝或忽略的配置总数 |
| pilot_total_xds_internal_errors | Sum | Pilot 中 XDS 内部错误总数 |
| pilot_total_xds_rejects | Sum | Pilot 被代理拒绝响应的 XDS 总数 |
| pilot_virt_services | LastValue | Pilot 已知的 VirtualService 总数 |
| pilot_vservice_dup_domain | LastValue | 具有重复数据的 VirtualService |
| pilot_xds | LastValue | 连接到 Pilot 此 XDS 的 Endpoint 数量 |
| pilot_xds_cds_reject | LastValue | Pilot 拒绝的 CDS 数量 |
| pilot_xds_config_size_bytes | Distribution | 推送 xds 的配置大小 |
| pilot_xds_delayed_push_timeouts_total | Sum | 延迟和超时的 XDS 推送总数 |
| pilot_xds_delayed_pushes_total | Sum | 延迟的 XDS 推送总数 |
| pilot_xds_eds_reject | LastValue | Pilot 拒绝的EDS。e即endpoint,eds用于动态发现服务 Endpoint |
| pilot_xds_expired_nonce | Sum | 过期的XDS请求总数 |
| pilot_xds_lds_reject | LastValue | pilot 拒绝 LDS 的配置。DS即discovery service,服务发现。envoy的监听端口,lds用于动态发现envoy需要监听哪些端口 |
| pilot_xds_push_context_errors | Sum | 推送 XDS 配置的错误数 |
| pilot_xds_push_time | Distribution | pilot 获取 XDS 配置所需要的时间(秒) |
| pilot_xds_pushes | Sum | Pilot 创建和下发 XDS 配置出现错误 |
| pilot_xds_rds_reject | LastValue | Pilot 拒绝 RDS配置。R即路由,rds用于发现路由配置 |
| pilot_xds_send_time | Distribution | Pilot 生成和下发配置所需要的时间 (秒) |
| pilot_xds_write_timeout | Sum | Pilot 响应 XDS 超时 |
| remote_cluster_sync_timeouts_total | Sum | 远程集群同步花费的时间太长,导致启动缓慢的次数(不包括远程集群) |
| scrape_failures_total | Sum | 失败的 scrapes 总数 |
| scrapes_total | Sum | scrapes 的总数 |
| sidecar_injection_failure_total | Sum | sidecar 注入失败的请求总数 |
| sidecar_injection_requests_total | Sum | sidecar 注入的请求总数 |
| sidecar_injection_skip_total | Sum | 跳过 sidecar 注入请求总数 |
| sidecar_injection_success_total | Sum | sidecar 成功注入的请求总数 |
| startup_duration_seconds | LastValue | 进程启动后标记就绪时间 |
| wasm_cache_entries | LastValue | Wasm 获取的远端缓存的 Entry 数量 |
| wasm_cache_lookup_count | Sum | Wasm 获取远端缓存的查找数 |
| wasm_config_conversion_count | Sum | Wasm 配置转换计数和结果的数目,包括成功、无远程加载、封送失败、远程获取失败、未命中远程获取提示 |
| wasm_config_conversion_duration | Distribution | istio-agent 在 Wasm 配置中转换远程负载所花费的总时间(毫秒) |
| wasm_remote_fetch_count | Sum | Wasm 远程获取的次数和结果,包括成功、下载失败和校验和不匹配 |
| webhook_patch_attempts_total | Sum | Webhook 尝试修补 |
| webhook_patch_failures_total | Sum | Webhook 修补失败次数 |
| webhook_patch_retries_total | Sum | Webhook 修补重试次数 |
| xds_cache_dependent_config_size | LastValue | 当前 XDS 缓存配置依赖的大小 |
| xds_cache_evictions | Sum | XDS 缓存回收的总数 |
| xds_cache_reads | Sum | XDS 缓存读取的总数 |
| xds_cache_size | LastValue | 当前 XDS 缓存大小 |
数据平面指标如下所示:
| 指标名称 | 指标类型 | 指标说明 |
|---|---|---|
| auto_registration_deletes_total | Sum | 周期性清理的自动注册的总数 |
| auto_registration_errors_total | Sum | 自动注册错误的总数 |
| auto_registration_success_total | Sum | 自动注册成功的总数 |
| auto_registration_unregister_total | Sum | 未自动注册的总数 |
| auto_registration_updates_total | Sum | 自动注册更新的总数 |
| controller_sync_errors_total | Sum | errorMetric 同步控制器的总数 |
| endpoint_no_pod | LastValue | Endpoint 没有关联任何 pod |
| envoy_connection_terminations | Sum | Envoy 连接错误的总数 |
| istio_build | LastValue | Istio 组件构成信息 |
| istiod_connection_failures | Sum | 连接到 Istio 控制面失败总数 |
| istiod_connection_terminations | Sum | 连接到 Istio 控制面错误总数 |
| istiod_managed_clusters | LastValue | 控制面管理的集群数 |
| num_failed_outgoing_requests | Sum | 传出失败的请求数(例如 token 交换或者对接 CA) |
| num_file_secret_failures_total | Sum | Secret 文件生成失败总次数 |
| num_file_watcher_failures_total | Sum | 未能添加监控程序的文件的总数 |
| num_outgoing_requests | Sum | 传出的请求总数 |
| num_outgoing_retries | Sum | 传出的重试请求总数 |
| outgoing_latency | Sum | 传出请求的延迟(毫秒) |
| pilot_conflict_inbound_listener | LastValue | 冲突的 inbound listener |
| pilot_conflict_outbound_listener_http_over_current_tcp | LastValue | 与当前 outbound TCP Listener 冲突的 HTTP Listener 总数 |
| pilot_conflict_outbound_listener_tcp_over_current_http | LastValue | 与当前 outbound 的 HTTP Listener 冲突的 TCP Listener 总数 |
| pilot_conflict_outbound_listener_tcp_over_current_tcp | LastValue | 与当前 outbound 的 TCP Listener 冲突的 TCP Listener 总数 |
| pilot_destrule_subsets | LastValue | DestinationRules 中关于同一服务的子集配置重复 |
| pilot_duplicate_envoy_clusters | LastValue | 具有相同主机名的 ServiceEntriy 导致 Envoy 集群重复 |
| pilot_eds_no_instances | LastValue | 没有任何实例的集群数 |
| pilot_endpoint_not_ready | LastValue | Endpoint 处于未就绪状态 |
| pilot_inbound_updates | Sum | Pilot 接收到 inbound 的更新的总数 |
| pilot_jwks_resolver_network_fetch_fail_total | Sum | Pilot 引导 jwks 解析器获取网络失败的总数 |
| pilot_jwks_resolver_network_fetch_success_total | Sum | Pilot 引导 jwks 解析器获取网络成功的总数 |
| pilot_k8s_cfg_events | Sum | K8s 配置中发生的事件 |
| pilot_k8s_endpoints_pending_pod | LastValue | 当前没有对应 pod 的 endpoint 个数 |
| pilot_k8s_endpoints_with_no_pods | Sum | 没有对应 pod 的 endpoint 个数,已废弃 |
| pilot_k8s_reg_events | Sum | 注册的 k8s handler 个数,维度包括 add、updatesame、update 等 |
| pilot_no_ip | LastValue | 没有对应服务代理 id。理论上这个指标不会有值? |
| pilot_proxy_convergence_time | Distribution | 配置变更后到代理接收到配置的耗时 |
| pilot_proxy_queue_time | Distribution | 推送开始后到真正出队处理的耗时 |
| pilot_push_triggers | Sum | 触发推送 xds 的次数,包括维度:Endpoint 更新、配置更新、服务更新等 |
| pilot_pushcontext_init_seconds | Distribution | 初始化 pushContext 的耗时 |
| pilot_sds_certificate_errors_total | Sum | 推送 xds 时获取 sds key 和证书失败的次数 |
| pilot_services | LastValue | 控制面感知到的服务数量 |
| pilot_total_rejected_configs | Sum | 当指向同一负载有多个网关时,需进行合并,合并过程中配置被拒绝的次数 |
| pilot_total_xds_internal_errors | Sum | 接收或移除连接时出错的次数 |
| pilot_total_xds_rejects | Sum | 对于服务发现 request 无需响应 xds 的次数 |
| pilot_virt_services | LastValue | 当前 vs 总数 |
| pilot_vservice_dup_domain | LastValue | 构建 sidecar outbound 时,由于重复 hostname 而被拒绝的 vs 数量 |
| pilot_xds | LastValue | 连接控制面的 envoy 数量 |
| pilot_xds_cds_reject | LastValue | 对于服务发现 request 无需响应 cds 的次数 |
| pilot_xds_config_size_bytes | Distribution | 推送 xds 的配置大小 |
| pilot_xds_delayed_push_timeouts_total | Sum | 推送 xds 过早或死锁造成的超时次数哦。 |
| pilot_xds_delayed_pushes_total | Sum | 推送 xds 延迟的个数。 |
| pilot_xds_eds_reject | LastValue | 对于服务发现 request 无需响应 eds 的次数 |
| pilot_xds_expired_nonce | Sum | 服务发现 request 携带过期的 nonce 的个数 |
| pilot_xds_lds_reject | LastValue | 对于服务发现 request 无需响应 lds 的次数 |
| pilot_xds_push_context_errors | Sum | 初始化 push context 失败次数 |
| pilot_xds_push_time | Distribution | 推送 xds 的耗时,实时变化,包括维度 lds、rds、cds、eds |
| pilot_xds_pushes | Sum | 推送 xds 失败的次数,包括 cds、eds、lds、rds |
| pilot_xds_rds_reject | LastValue | 对 服务发现 request 无需响应 rds 的次数 |
| pilot_xds_send_time | Distribution | 推送 xds 耗时 |
| pilot_xds_write_timeout | Sum | 推送 xds 超时次数 |
| remote_cluster_sync_timeouts_total | Sum | 启动远程集群的 informer,并等待缓存同步的超时次数 |
| scrape_failures_total | Sum | 采集指标失败次数,包括 envoy、app、agent |
| scrapes_total | Sum | 指标采集总次数 |
| sidecar_injection_failure_total | Sum | mutating webhook 注入 sidecar 失败的数量 |
| sidecar_injection_requests_total | Sum | mutating webhook 注入 sidecar 的请求数 |
| sidecar_injection_skip_total | Sum | 策略检查后跳过 sidecar 注入的数量 |
| sidecar_injection_success_total | Sum | sidecar 注入成功数 |
| startup_duration_seconds | LastValue | agent 启动耗时。依赖健康检查探针,因此与探活周期相关 |
| wasm_cache_entries | LastValue | wasm 缓存中 wasm module 的数量 |
| wasm_cache_lookup_count | Sum | wasm 缓存命中数 |
| wasm_config_conversion_count | Sum | 从远程下载的 wasm module 尝试转换成本地文件的数量 |
| wasm_config_conversion_duration | Distribution | 远程下载的 wasm module 转换成本地文件的耗时 |
| wasm_remote_fetch_count | Sum | 从远程下载的 wasm module 数量,包括维度成功、失败、校验和不匹配等 |
| webhook_patch_attempts_total | Sum | webhook 尝试 patch 的次数 |
| webhook_patch_failures_total | Sum | webhook patch 失败的次数 |
| webhook_patch_retries_total | Sum | webhook patch 失败后重试的次数 |
| xds_cache_dependent_config_size | LastValue | 当前依赖配置的大小,包括 cluster、route、eds、sds等 |
| xds_cache_evictions | Sum | xds 缓存驱逐的总数,包括维度:clear、size |
| xds_cache_reads | Sum | xds 缓存 xdsCacheReads 的总数,包括维度:hit、miss |
| xds_cache_size | LastValue | xds 缓存大小 |
| xds_proxy_requests | Sum | 下游发起请求的总数 |
| xds_proxy_responses | Sum | 上游响应总数 |
参考
- https://istio.io/latest/docs/tasks/observability/metrics/
- https://istio.io/latest/docs/ops/configuration/telemetry/
- https://istio.io/latest/docs/ops/configuration/telemetry/envoy-stats/
- https://istio.io/latest/docs/tasks/observability/metrics/querying-metrics/
- https://istio.io/latest/docs/tasks/observability/metrics/using-istio-dashboard/