部署 Istio 与周边组件
部署 Istio 参考 getting-started。
部署 Prometheus 参考 Querying Metrics from Prometheus。
部署 Grafana 参考 Visualizing Metrics with Grafana。
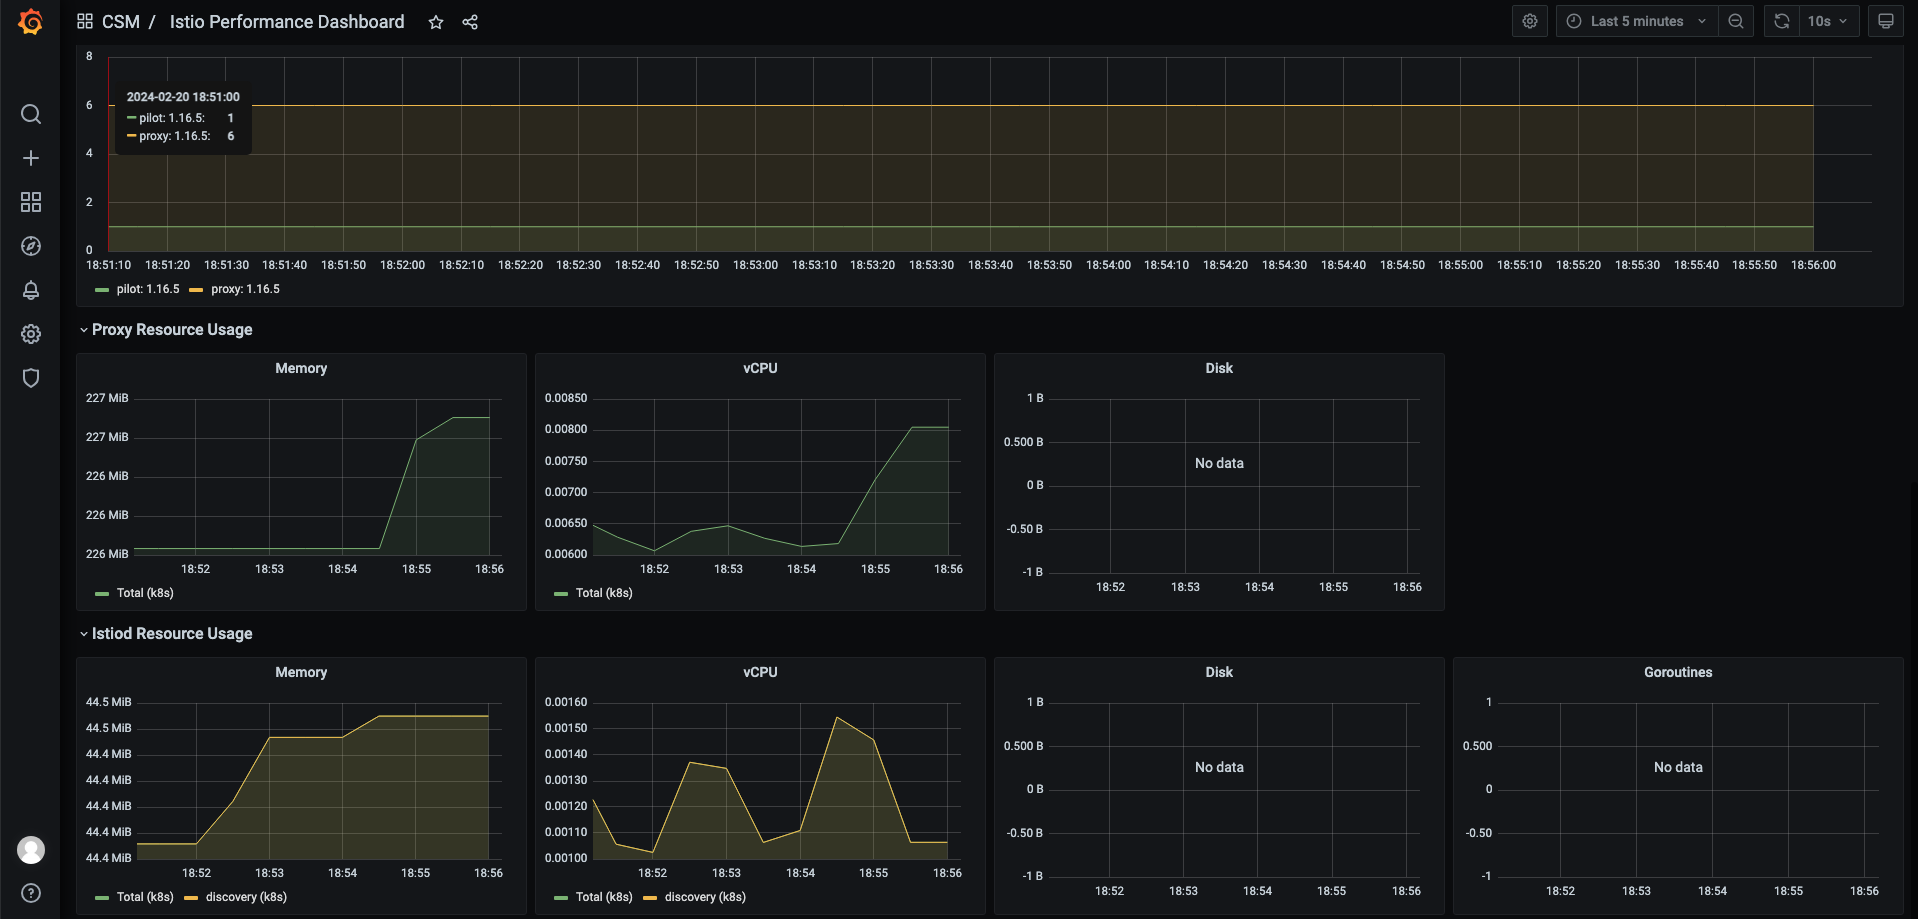
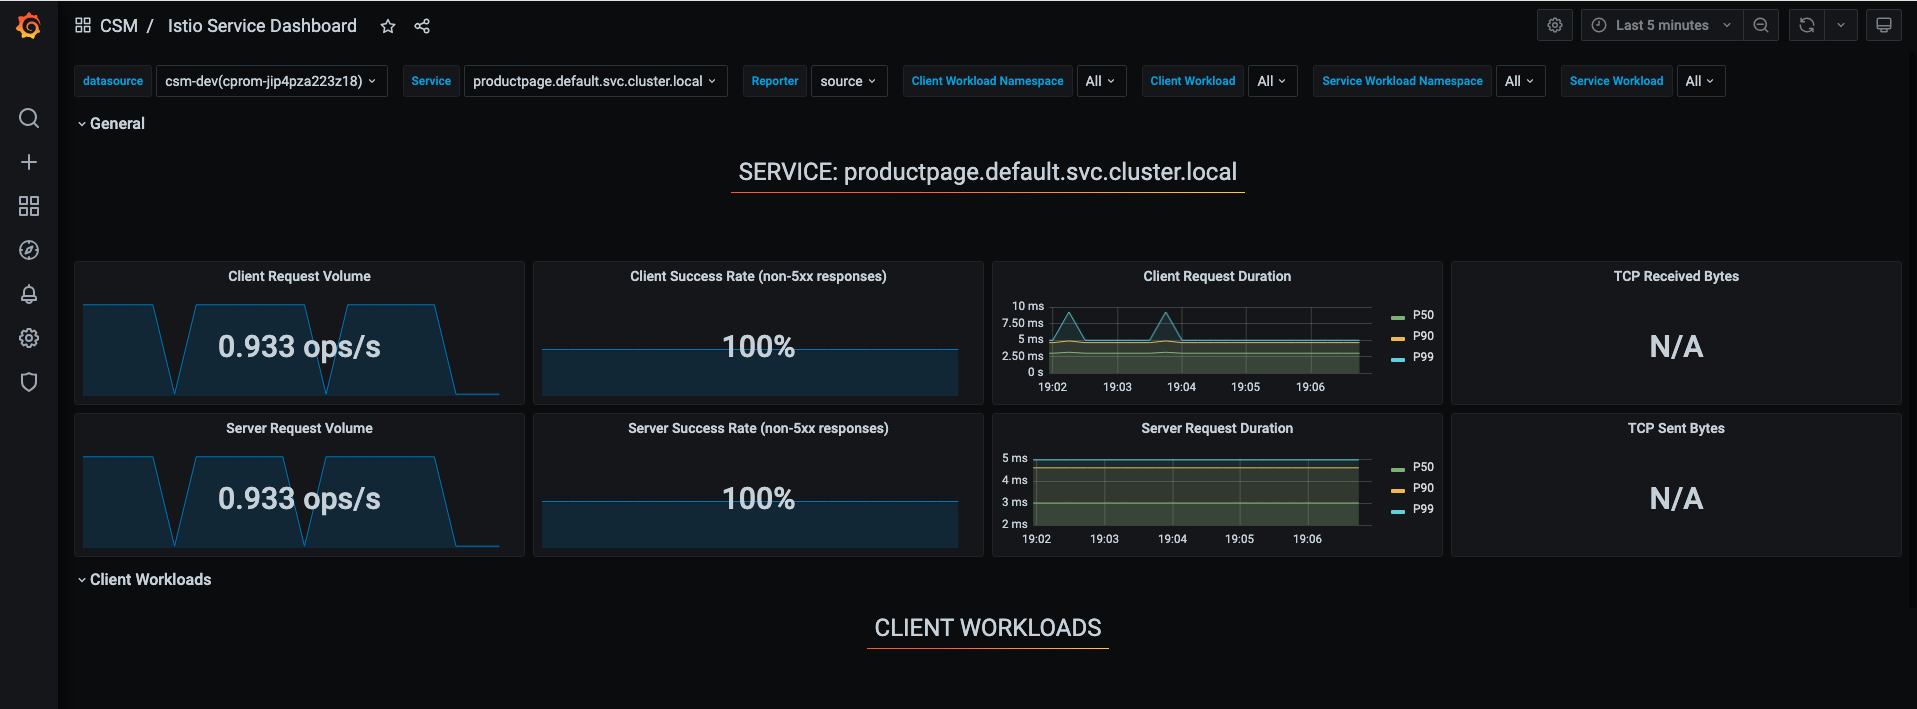
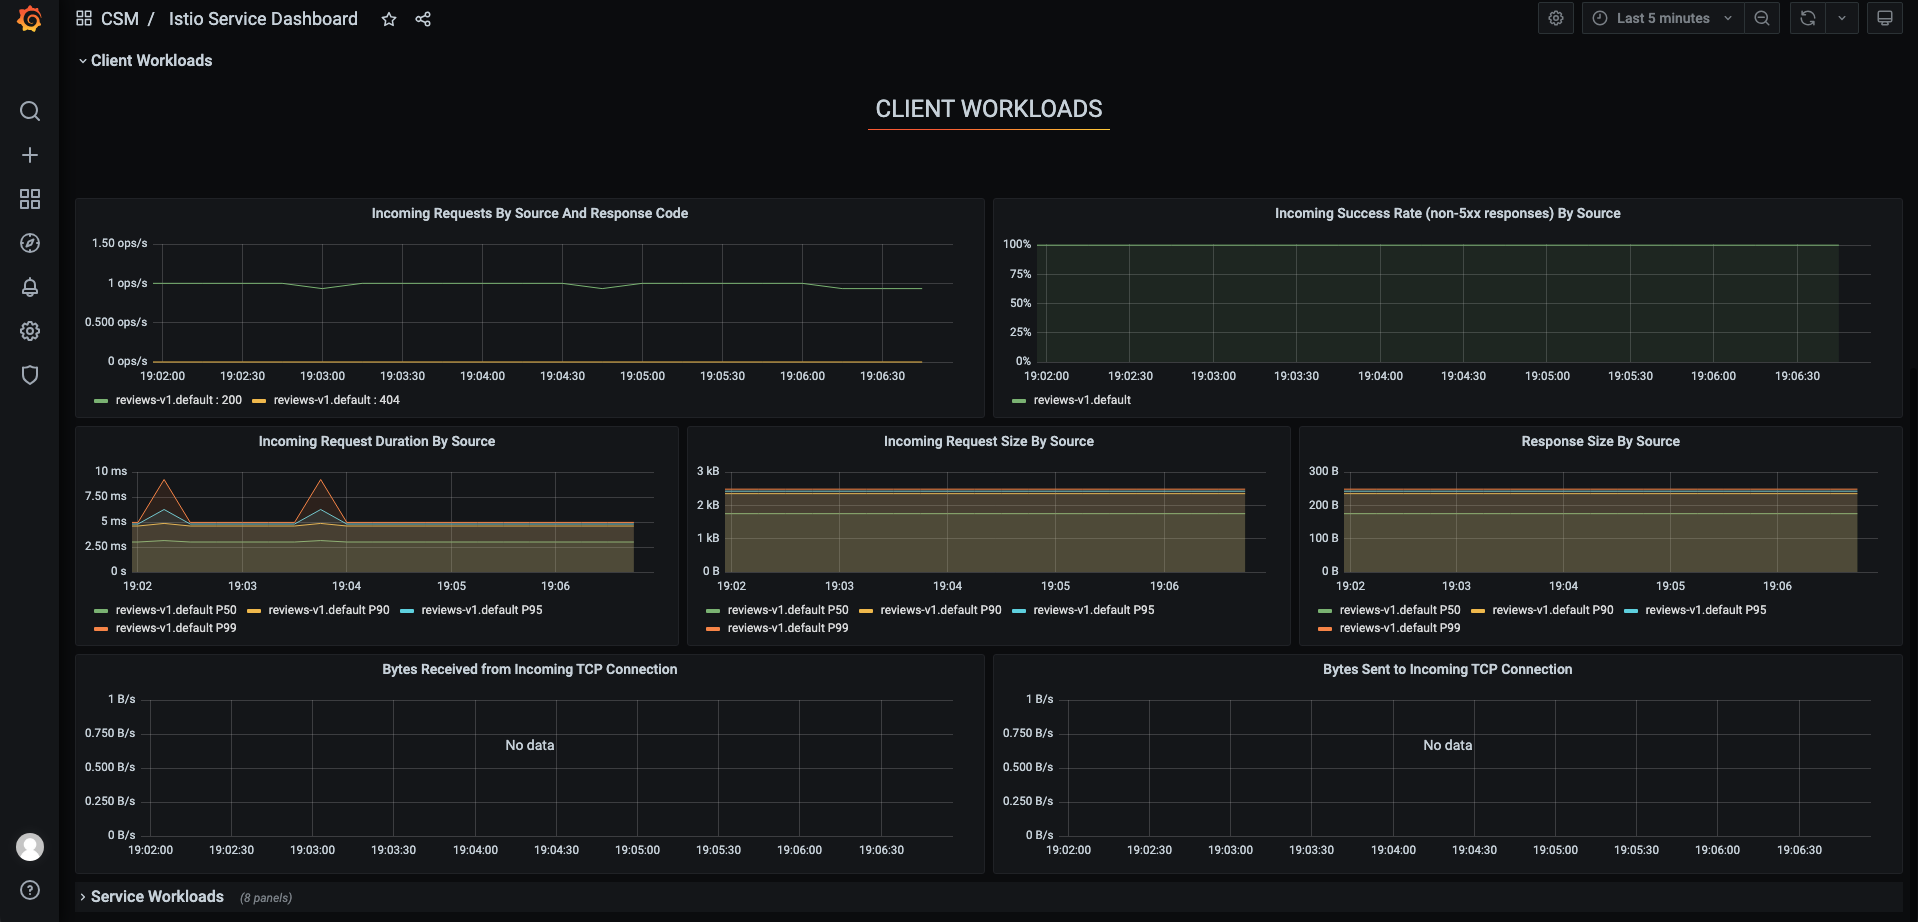
原生 Istio Grafana 监控面板
我们首先查看 Istio 原生 Grafana 大盘,如下图所示:
监控告警
在 Istio 服务网格中,每个组件都暴露了一个用于生成指标的接口,Prometheus 通过抓取这些接口并收集结果来实现工作。这是通过 Prometheus 的配置文件进行配置的,该文件控制要查询的接口、查询的端口和路径、TLS 设置等配置。
要收集整个网格的指标信息,需要配置 Prometheus,如下所示:
- 控制平面(istiod deployment)
- 入口和出口网关
- Envoy sidecar
- 用户应用程序(如果它们暴露了 Prometheus 指标)
要抓取 Istiod 数据,需要将以下 job 添加到抓取其 http-monitoring 端口,如下所示:
job_name: 'istiod'
kubernetes_sd_configs:
- role: endpoints
  namespaces:
    names:
    - istio-system
relabel_configs:
- source_labels: [__meta_kubernetes_service_name, __meta_kubernetes_endpoint_port_name]
  action: keep
  regex: istiod;http-monitoring
要抓取 Envoy 数据,包括 sidecar 代理和网关代理,需要将以下 job 添加到抓取以 -envoy-prom 结尾的端口,如下所示:
job_name: 'envoy-stats'
metrics_path: /stats/prometheus
kubernetes_sd_configs:
- role: pod

relabel_configs:
- source_labels: [__meta_kubernetes_pod_container_port_name]
  action: keep
  regex: '.*-envoy-prom'
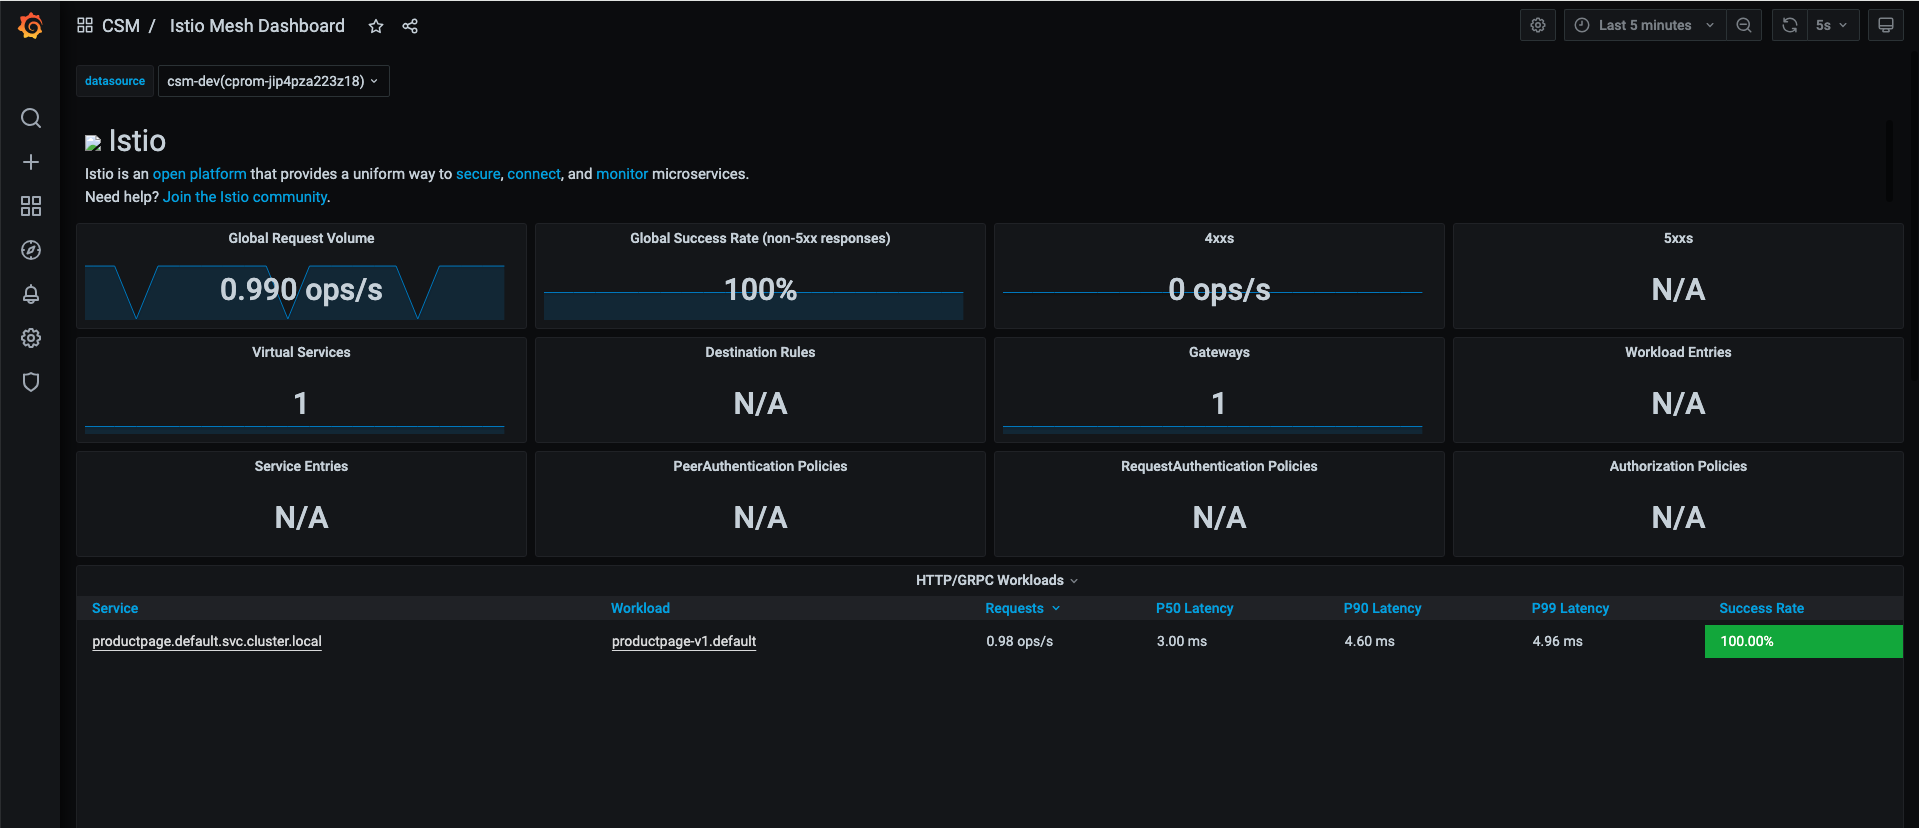
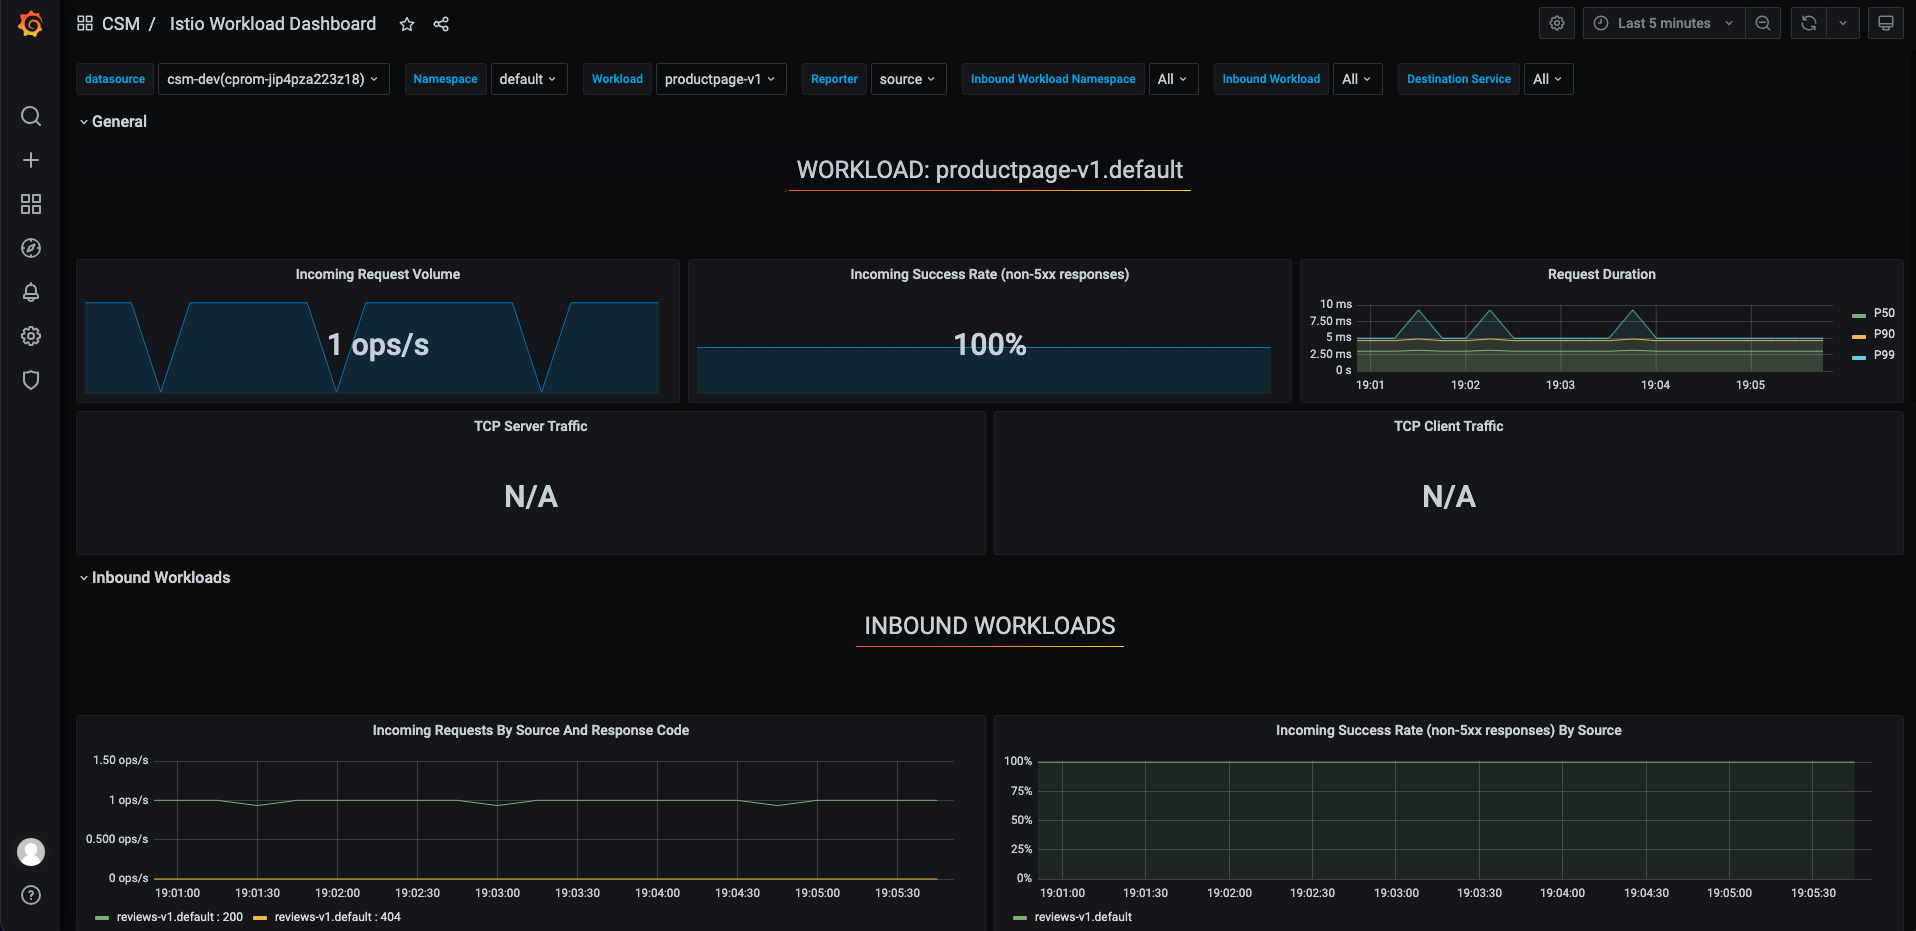
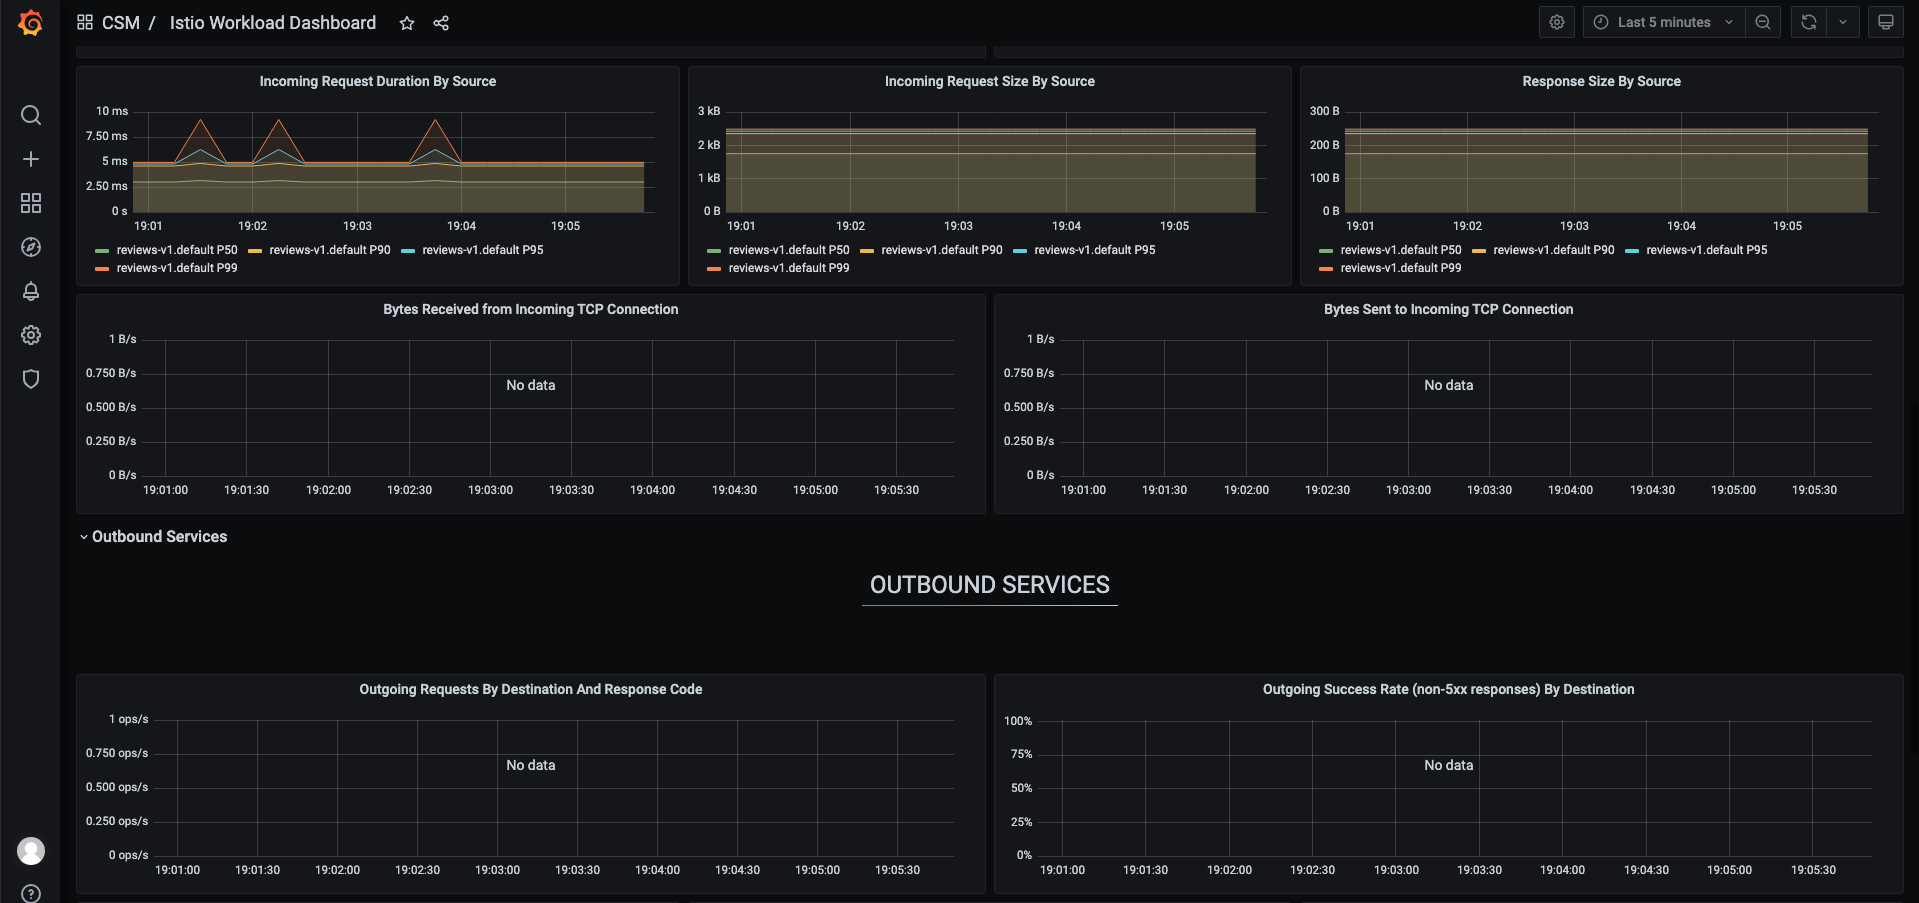
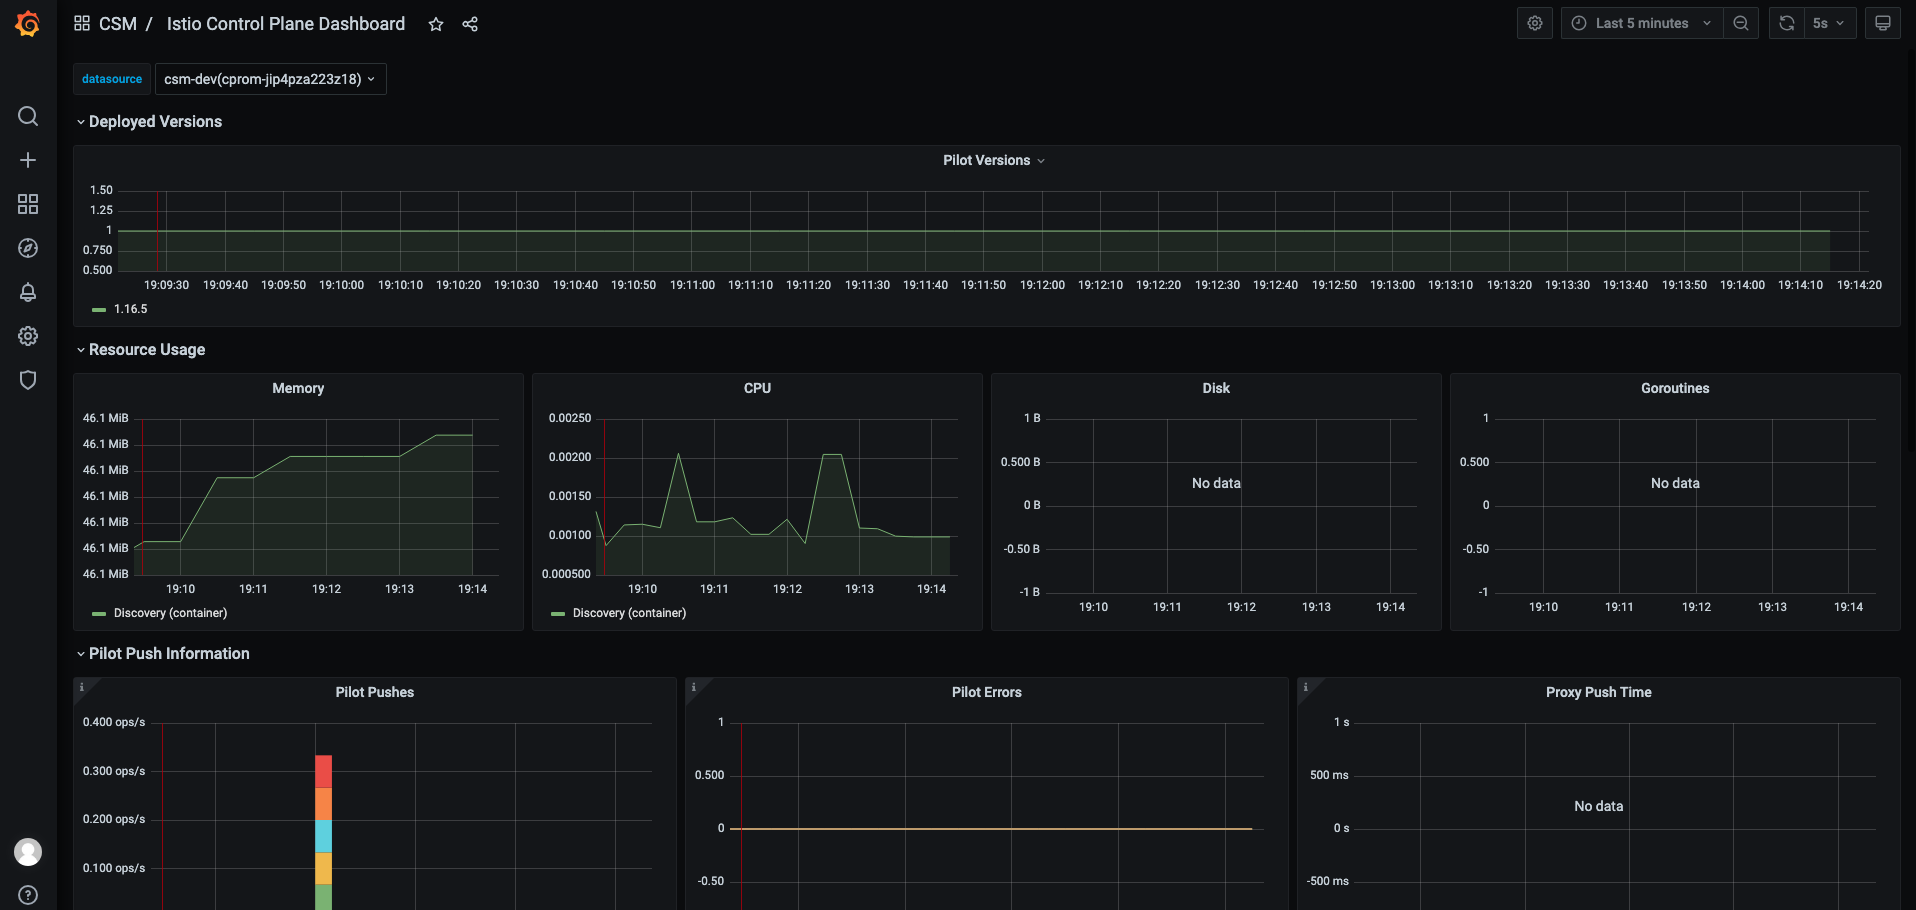
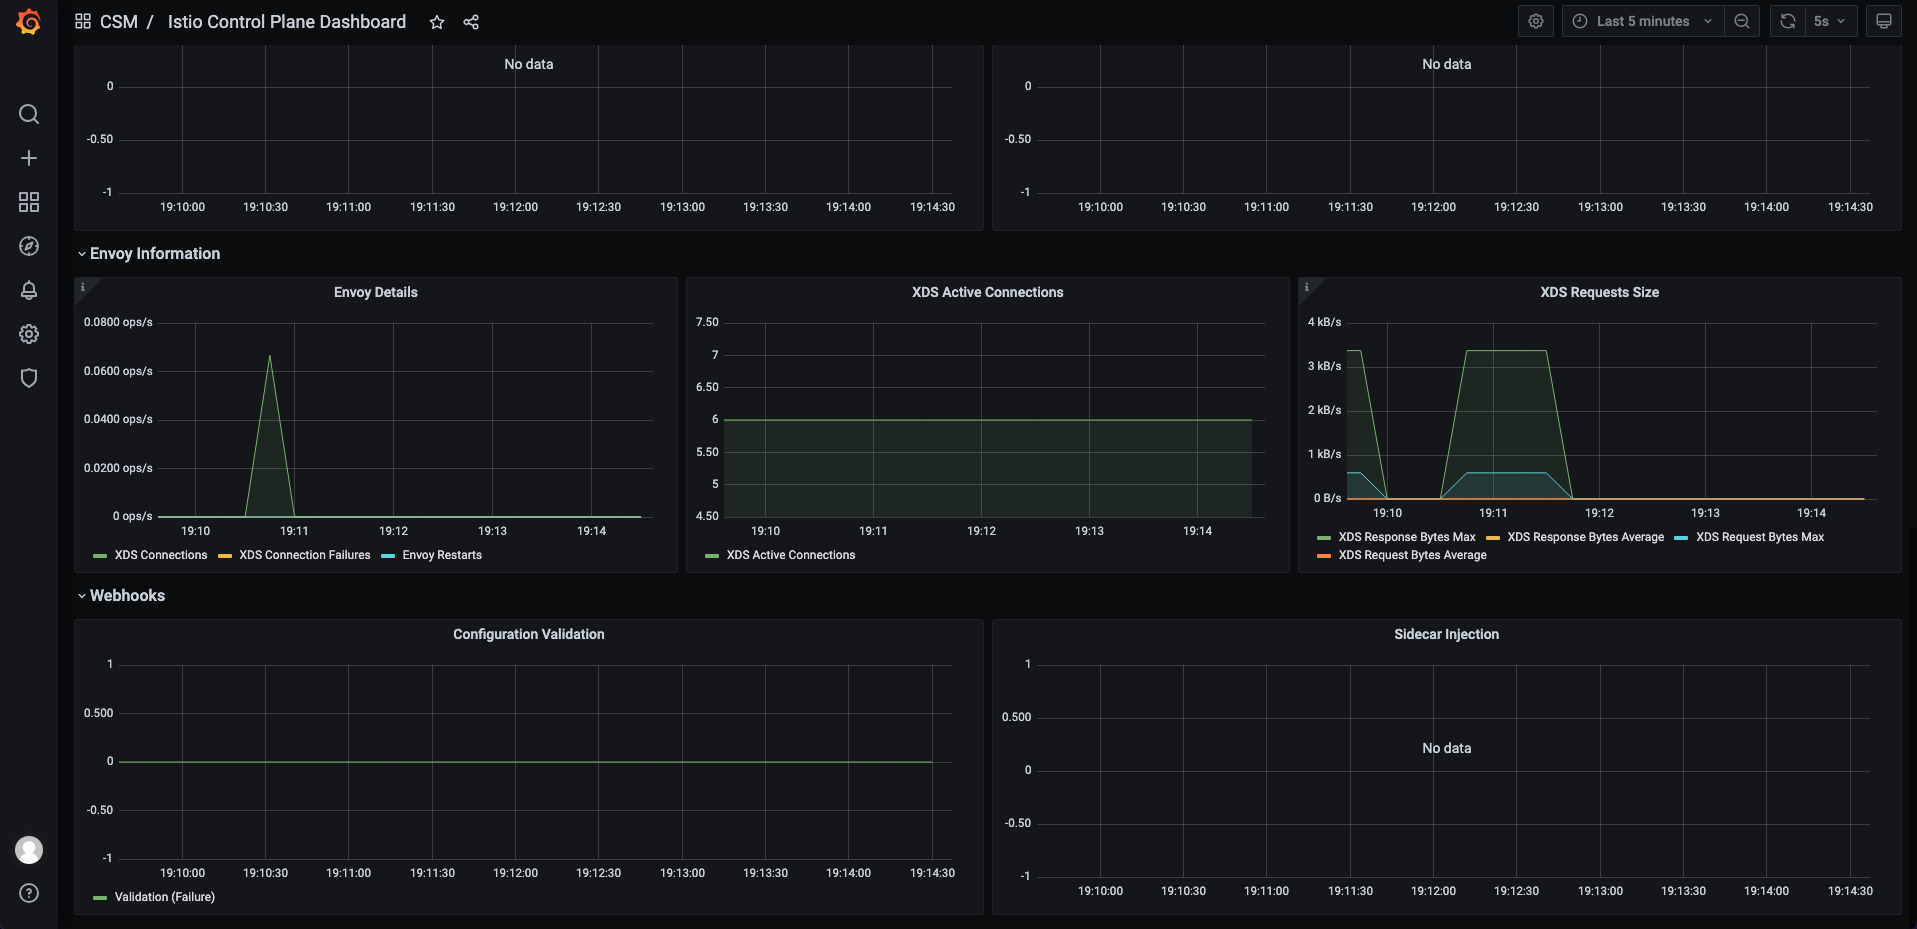
我们在给 Prometheus 添加了以上配置后,我们可以通过 Grafana 的 UI 查看抓取到的数据,如下图所示:
我们给 Istio 配置告警前,我们先简单了解下 Prometheus 基本知识。
一个有效的 Prometheus Configuration 配置文件如下所示:
# my global config
global:
  scrape_interval: 15s
  evaluation_interval: 30s
  body_size_limit: 15MB
  sample_limit: 1500
  target_limit: 30
  label_limit: 30
  label_name_length_limit: 200
  label_value_length_limit: 200
  # scrape_timeout is set to the global default (10s).

  external_labels:
    monitor: codelab
    foo: bar

rule_files:
  - "first.rules"
  - "my/*.rules"

remote_write:
  - url: http://remote1/push
    name: drop_expensive
    write_relabel_configs:
      - source_labels: [__name__]
        regex: expensive.*
        action: drop
    oauth2:
      client_id: "123"
      client_secret: "456"
      token_url: "http://remote1/auth"
      tls_config:
        cert_file: valid_cert_file
        key_file: valid_key_file

  - url: http://remote2/push
    name: rw_tls
    tls_config:
      cert_file: valid_cert_file
      key_file: valid_key_file
    headers:
      name: value

remote_read:
  - url: http://remote1/read
    read_recent: true
    name: default
    enable_http2: false
  - url: http://remote3/read
    read_recent: false
    name: read_special
    required_matchers:
      job: special
    tls_config:
      cert_file: valid_cert_file
      key_file: valid_key_file

scrape_configs:
  - job_name: prometheus

    honor_labels: true
    # scrape_interval is defined by the configured global (15s).
    # scrape_timeout is defined by the global default (10s).

    # metrics_path defaults to '/metrics'
    # scheme defaults to 'http'.

    file_sd_configs:
      - files:
          - foo/*.slow.json
          - foo/*.slow.yml
          - single/file.yml
        refresh_interval: 10m
      - files:
          - bar/*.yaml

    static_configs:
      - targets: ["localhost:9090", "localhost:9191"]
        labels:
          my: label
          your: label

    relabel_configs:
      - source_labels: [job, __meta_dns_name]
        regex: (.*)some-[regex]
        target_label: job
        replacement: foo-${1}
        # action defaults to 'replace'
      - source_labels: [abc]
        target_label: cde
      - replacement: static
        target_label: abc
      - regex:
        replacement: static
        target_label: abc
      - source_labels: [foo]
        target_label: abc
        action: keepequal
      - source_labels: [foo]
        target_label: abc
        action: dropequal

    authorization:
      credentials_file: valid_token_file

    tls_config:
      min_version: TLS10

  - job_name: service-x

    basic_auth:
      username: admin_name
      password: "multiline\nmysecret\ntest"

    scrape_interval: 50s
    scrape_timeout: 5s
    scrape_protocols: ["PrometheusText0.0.4"]

    body_size_limit: 10MB
    sample_limit: 1000
    target_limit: 35
    label_limit: 35
    label_name_length_limit: 210
    label_value_length_limit: 210

    metrics_path: /my_path
    scheme: https

    dns_sd_configs:
      - refresh_interval: 15s
        names:
          - first.dns.address.domain.com
          - second.dns.address.domain.com
      - names:
          - first.dns.address.domain.com

    relabel_configs:
      - source_labels: [job]
        regex: (.*)some-[regex]
        action: drop
      - source_labels: [__address__]
        modulus: 8
        target_label: __tmp_hash
        action: hashmod
      - source_labels: [__tmp_hash]
        regex: 1
        action: keep
      - action: labelmap
        regex: 1
      - action: labeldrop
        regex: d
      - action: labelkeep
        regex: k

    metric_relabel_configs:
      - source_labels: [__name__]
        regex: expensive_metric.*
        action: drop

  - job_name: service-y

    consul_sd_configs:
      - server: "localhost:1234"
        token: mysecret
        path_prefix: /consul
        services: ["nginx", "cache", "mysql"]
        tags: ["canary", "v1"]
        node_meta:
          rack: "123"
        allow_stale: true
        scheme: https
        tls_config:
          ca_file: valid_ca_file
          cert_file: valid_cert_file
          key_file: valid_key_file
          insecure_skip_verify: false

    relabel_configs:
      - source_labels: [__meta_sd_consul_tags]
        separator: ","
        regex: label:([^=]+)=([^,]+)
        target_label: ${1}
        replacement: ${2}

  - job_name: service-z

    tls_config:
      cert_file: valid_cert_file
      key_file: valid_key_file

    authorization:
      credentials: mysecret

  - job_name: service-kubernetes

    kubernetes_sd_configs:
      - role: endpoints
        api_server: "https://localhost:1234"
        tls_config:
          cert_file: valid_cert_file
          key_file: valid_key_file

        basic_auth:
          username: "myusername"
          password: "mysecret"

  - job_name: service-kubernetes-namespaces

    kubernetes_sd_configs:
      - role: endpoints
        api_server: "https://localhost:1234"
        namespaces:
          names:
            - default

    basic_auth:
      username: "myusername"
      password_file: valid_password_file

  - job_name: service-kuma

    kuma_sd_configs:
      - server: http://kuma-control-plane.kuma-system.svc:5676

  - job_name: service-marathon
    marathon_sd_configs:
      - servers:
          - "https://marathon.example.com:443"

        auth_token: "mysecret"
        tls_config:
          cert_file: valid_cert_file
          key_file: valid_key_file

  - job_name: service-nomad
    nomad_sd_configs:
      - server: 'http://localhost:4646'

  - job_name: service-ec2
    ec2_sd_configs:
      - region: us-east-1
        access_key: access
        secret_key: mysecret
        profile: profile
        filters:
          - name: tag:environment
            values:
              - prod

          - name: tag:service
            values:
              - web
              - db

  - job_name: service-lightsail
    lightsail_sd_configs:
      - region: us-east-1
        access_key: access
        secret_key: mysecret
        profile: profile

  - job_name: service-azure
    azure_sd_configs:
      - environment: AzurePublicCloud
        authentication_method: OAuth
        subscription_id: 11AAAA11-A11A-111A-A111-1111A1111A11
        resource_group: my-resource-group
        tenant_id: BBBB222B-B2B2-2B22-B222-2BB2222BB2B2
        client_id: 333333CC-3C33-3333-CCC3-33C3CCCCC33C
        client_secret: mysecret
        port: 9100

  - job_name: service-nerve
    nerve_sd_configs:
      - servers:
          - localhost
        paths:
          - /monitoring

  - job_name: 0123service-xxx
    metrics_path: /metrics
    static_configs:
      - targets:
          - localhost:9090

  - job_name: badfederation
    honor_timestamps: false
    metrics_path: /federate
    static_configs:
      - targets:
          - localhost:9090

  - job_name: 測試
    metrics_path: /metrics
    static_configs:
      - targets:
          - localhost:9090

  - job_name: httpsd
    http_sd_configs:
      - url: "http://example.com/prometheus"

  - job_name: service-triton
    triton_sd_configs:
      - account: "testAccount"
        dns_suffix: "triton.example.com"
        endpoint: "triton.example.com"
        port: 9163
        refresh_interval: 1m
        version: 1
        tls_config:
          cert_file: valid_cert_file
          key_file: valid_key_file

  - job_name: digitalocean-droplets
    digitalocean_sd_configs:
      - authorization:
          credentials: abcdef

  - job_name: docker
    docker_sd_configs:
      - host: unix:///var/run/docker.sock

  - job_name: dockerswarm
    dockerswarm_sd_configs:
      - host: http://127.0.0.1:2375
        role: nodes

  - job_name: service-openstack
    openstack_sd_configs:
      - role: instance
        region: RegionOne
        port: 80
        refresh_interval: 1m
        tls_config:
          ca_file: valid_ca_file
          cert_file: valid_cert_file
          key_file: valid_key_file

  - job_name: service-puppetdb
    puppetdb_sd_configs:
      - url: https://puppetserver/
        query: 'resources { type = "Package" and title = "httpd" }'
        include_parameters: true
        port: 80
        refresh_interval: 1m
        tls_config:
          ca_file: valid_ca_file
          cert_file: valid_cert_file
          key_file: valid_key_file

  - job_name: hetzner
    relabel_configs:
      - action: uppercase
        source_labels: [instance]
        target_label: instance
    hetzner_sd_configs:
      - role: hcloud
        authorization:
          credentials: abcdef
      - role: robot
        basic_auth:
          username: abcdef
          password: abcdef

  - job_name: service-eureka
    eureka_sd_configs:
      - server: "http://eureka.example.com:8761/eureka"

  - job_name: ovhcloud
    ovhcloud_sd_configs:
      - service: vps
        endpoint: ovh-eu
        application_key: testAppKey
        application_secret: testAppSecret
        consumer_key: testConsumerKey
        refresh_interval: 1m
      - service: dedicated_server
        endpoint: ovh-eu
        application_key: testAppKey
        application_secret: testAppSecret
        consumer_key: testConsumerKey
        refresh_interval: 1m

  - job_name: scaleway
    scaleway_sd_configs:
      - role: instance
        project_id: 11111111-1111-1111-1111-111111111112
        access_key: SCWXXXXXXXXXXXXXXXXX
        secret_key: 11111111-1111-1111-1111-111111111111
      - role: baremetal
        project_id: 11111111-1111-1111-1111-111111111112
        access_key: SCWXXXXXXXXXXXXXXXXX
        secret_key: 11111111-1111-1111-1111-111111111111

  - job_name: linode-instances
    linode_sd_configs:
      - authorization:
          credentials: abcdef

  - job_name: uyuni
    uyuni_sd_configs:
      - server: https://localhost:1234
        username: gopher
        password: hole

  - job_name: ionos
    ionos_sd_configs:
      - datacenter_id: 8feda53f-15f0-447f-badf-ebe32dad2fc0
        authorization:
          credentials: abcdef

  - job_name: vultr
    vultr_sd_configs:
      - authorization:
          credentials: abcdef

alerting:
  alertmanagers:
    - scheme: https
      static_configs:
        - targets:
            - "1.2.3.4:9093"
            - "1.2.3.5:9093"
            - "1.2.3.6:9093"

storage:
  tsdb:
    out_of_order_time_window: 30m

tracing:
  endpoint: "localhost:4317"
  client_type: "grpc"
  headers:
    foo: "bar"
  timeout: 5s
  compression: "gzip"
  tls_config:
    cert_file: valid_cert_file
    key_file: valid_key_file
    insecure_skip_verify: true
告警规则示例如下所示:
groups:
- name: example
  rules:
  - alert: HighRequestLatency
    expr: job:request_latency_seconds:mean5m{job="myjob"} > 0.5
    for: 10m
    labels:
      severity: page
    annotations:
      summary: High request latency
- alert:定义一个告警规则。
- expr:定义一个PromQL表达式,用于描述告警的条件。
- for:定义告警的持续时间。例如,如果一个告警的for设置为10m,那么这个告警只会在表达式满足条件10分钟时触发。
- labels:用于定义告警的标签,可以用于分类和过滤告警。
- annotations:用于为告警提供附加信息,例如告警的描述、告警的严重性等。
具体关于 Prometheus 告警规则的介绍,可以参考 Prometheus Alerting Rules。
完成上述基础配置后,我们就可以给 Istio 配置告警。我们在上篇文章中详解过Istio 核心指标,接下来我们针对这些 Istio 核心指标配置监控告警,以下是 Istio 1.16.5 版本为示例。
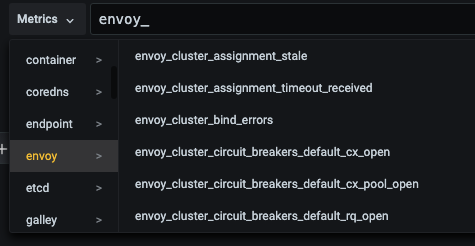
kubectl exec -it reviews-v1-6955fcdd8d-d5s58  -- curl localhost:15000/stats/prometheus | grep envoy_
# TYPE envoy_cluster_assignment_stale counter
envoy_cluster_assignment_stale{cluster_name="xds-grpc"} 0
# TYPE envoy_cluster_assignment_timeout_received counter
envoy_cluster_assignment_timeout_received{cluster_name="xds-grpc"} 0
# TYPE envoy_cluster_bind_errors counter
envoy_cluster_bind_errors{cluster_name="xds-grpc"} 0
# TYPE envoy_cluster_default_total_match_count counter
envoy_cluster_default_total_match_count{cluster_name="xds-grpc"} 1
# TYPE envoy_cluster_http2_dropped_headers_with_underscores counter
envoy_cluster_http2_dropped_headers_with_underscores{cluster_name="xds-grpc"} 0
# TYPE envoy_cluster_http2_header_overflow counter
envoy_cluster_http2_header_overflow{cluster_name="xds-grpc"} 0
# TYPE envoy_cluster_http2_headers_cb_no_stream counter
envoy_cluster_http2_headers_cb_no_stream{cluster_name="xds-grpc"} 0
# TYPE envoy_cluster_http2_inbound_empty_frames_flood counter
envoy_cluster_http2_inbound_empty_frames_flood{cluster_name="xds-grpc"} 0
# TYPE envoy_cluster_http2_inbound_priority_frames_flood counter
envoy_cluster_http2_inbound_priority_frames_flood{cluster_name="xds-grpc"} 0
# TYPE envoy_cluster_http2_inbound_window_update_frames_flood counter
envoy_cluster_http2_inbound_window_update_frames_flood{cluster_name="xds-grpc"} 0
# TYPE envoy_cluster_http2_keepalive_timeout counter
envoy_cluster_http2_keepalive_timeout{cluster_name="xds-grpc"} 0
# TYPE envoy_cluster_http2_metadata_empty_frames counter
envoy_cluster_http2_metadata_empty_frames{cluster_name="xds-grpc"} 0
# TYPE envoy_cluster_http2_outbound_control_flood counter
envoy_cluster_http2_outbound_control_flood{cluster_name="xds-grpc"} 0
# TYPE envoy_cluster_http2_outbound_flood counter
envoy_cluster_http2_outbound_flood{cluster_name="xds-grpc"} 0
...
数据平面告警示例如下所示:
- alert: IstioEnvoyInternalUpstreamReq503TooHigh
  annotations:
    summary: 'Envoy Percentage of HTTP 503 internal upstream responses is too high'
    description: "The amount of 503 internal upstream responses is higher than 1%. It is too high"
  expr: >
  rate(envoy_cluster_internal_upstream_rq_503[1m])/rate(envoy_cluster_internal_upstream_rq_completed[1m]) > 0.01

- alert: IstioEnvoyInternalUpstreamReq200TooLow
  annotations:
    summary: 'Envoy Percentage of HTTP 200 internal upstream responses is too low'
    description: "The amount of 200 internal upstream responses is lower than 99.9%. It is too low"
  expr: >
  rate(envoy_cluster_internal_upstream_rq_200[1m])/rate(envoy_cluster_internal_upstream_rq_completed[1m]) < 0.999

- alert: IstioEnvoyUpstreamReq503TooHigh
  annotations:
    summary: 'Envoy Percentage of HTTP 503 upstream responses is too high'
    description: "The amount of 503 upstream responses is higher than 1%. It is too high"
  expr: >
    rate(envoy_cluster_upstream_rq_503[1m])/rate(envoy_cluster_upstream_rq_completed[1m]) > 0.01

- alert: IstioEnvoyUpstreamReq200TooLow
  annotations:
    summary: 'Envoy Percentage of HTTP 200 upstream responses is too low'
    description: "The amount of 200 upstream responses is lower than 99.9%. It is too low"
  expr: >
    rate(envoy_cluster_upstream_rq_200[1m])/rate(envoy_cluster_upstream_rq_completed[1m]) < 0.999

- alert: IstioEnvoyClusterBindErrors
  annotations:
    summary: "Envoy cluster binding errors"
    description: "Error in binding cluster with {{ $labels.pod_name }}  pod in {{ $labels.namespace }} namespace."
  expr: >
    envoy_cluster_bind_errors > 0

- alert: IstioEnvoyClusterDstHostInvalid
  annotations:
    summary: "Envoy cluster destination host invalid"
    description: "Envoy cluster destination host {{ $labels.pod_name }} in {{ $labels.namespace }} namespace invalid for 1 minutes"
  expr: > envoy_cluster_original_dst_host_invalid > 0
  for: 1m
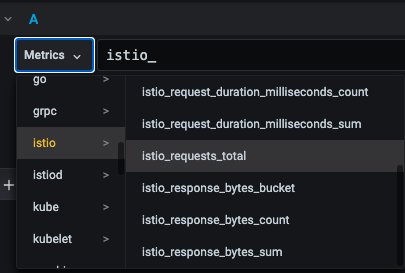
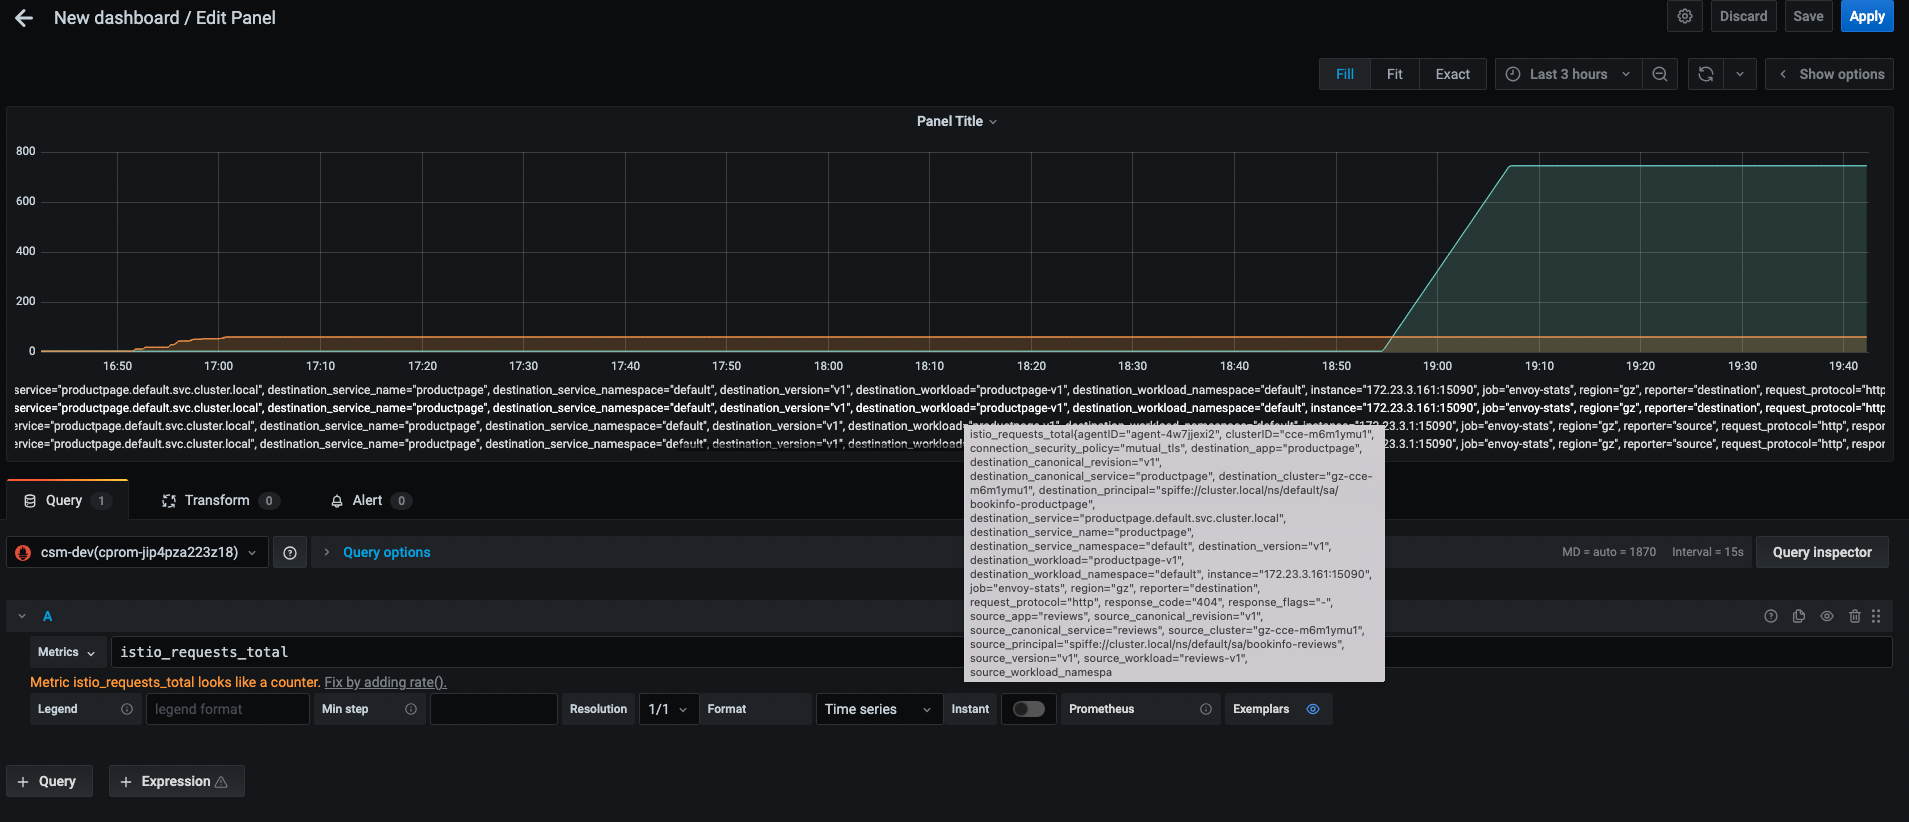
kubectl exec -it reviews-v1-6955fcdd8d-d5s58  -- curl localhost:15000/stats/prometheus | grep istio_ | head -n 10
# TYPE istio_requests_total counter
istio_requests_total{response_code="200",reporter="source",source_workload="reviews-v1",source_workload_namespace="default",source_principal="spiffe://cluster.local/ns/default/sa/bookinfo-reviews",source_app="reviews",source_version="v1",source_cluster="gz-cce-m6m1ymu1",destination_workload="productpage-v1",destination_workload_namespace="default",destination_principal="spiffe://cluster.local/ns/default/sa/bookinfo-productpage",destination_app="productpage",destination_version="v1",destination_service="productpage.default.svc.cluster.local",destination_service_name="productpage",destination_service_namespace="default",destination_cluster="gz-cce-m6m1ymu1",request_protocol="http",response_flags="-",grpc_response_status="",connection_security_policy="unknown",source_canonical_service="reviews",destination_canonical_service="productpage",source_canonical_revision="v1",destination_canonical_revision="v1"} 745
istio_requests_total{response_code="404",reporter="source",source_workload="reviews-v1",source_workload_namespace="default",source_principal="spiffe://cluster.local/ns/default/sa/bookinfo-reviews",source_app="reviews",source_version="v1",source_cluster="gz-cce-m6m1ymu1",destination_workload="productpage-v1",destination_workload_namespace="default",destination_principal="spiffe://cluster.local/ns/default/sa/bookinfo-productpage",destination_app="productpage",destination_version="v1",destination_service="productpage.default.svc.cluster.local",destination_service_name="productpage",destination_service_namespace="default",destination_cluster="gz-cce-m6m1ymu1",request_protocol="http",response_flags="-",grpc_response_status="",connection_security_policy="unknown",source_canonical_service="reviews",destination_canonical_service="productpage",source_canonical_revision="v1",destination_canonical_revision="v1"} 60
# TYPE istio_build gauge
istio_build{component="proxy",tag="1.16.5"} 1
# TYPE istio_request_bytes histogram
...
Istio 告警示例如下所示:
# ISTIO
- alert: IstiodAvailabilityDrop
  annotations:
    summary: 'Istiod Availability Drop'
    description: 'Istiod pods have dropped during the last 1m (current value: *{{ printf "%2.0f%%" $value }}*). Envoy sidecars might have outdated configuration'
  expr: >
        avg(avg_over_time(up{job="istiod"}[1m]))  < 0.5
  for: 1m

- alert: IstioLatency99Percentile
  expr: histogram_quantile(0.99, sum(rate(istio_request_duration_milliseconds_bucket[1d])) by (clusterID, region, destination_workload_namespace, source_canonical_service, source_workload_namespace, le)) > 1000
  for: 1m
  labels:
    severity: warning
  annotations:
    summary: Istio latency 99 percentile (instance {{ $labels.instance }})
    description: "Istio 1% slowest requests are longer than 1000ms.\n  VALUE = {{ $value }}\n  LABELS = {{ $labels }}"

- alert: IstiodAvailabilityDrop
  annotations:
    summary: 'Istiod Availability Drop'
    description: 'Istiod pods have dropped during the last 1m (current value: *{{ printf "%2.0f%%" $value }}*). Inbound traffic will likely be affected'
  expr: min(kube_deployment_spec_replicas{deployment="istiod", namespace="istio-system"}) < 0.5
  for: 1m

- alert: IstioNo200ResponseCodeRate
  expr: sum(rate(istio_requests_total{response_code!~"200", reporter="destination"}[5s])) > 0.01
  for: 1m
  labels:
    severity: warning
  annotations:
    summary: "Istio Non-200 Response Code Rate Alert"
    description: "Detected a high rate of non-200 response codes in Istio within a 5 second window"

- alert: IstioHigh4xxErrorRate
  expr: sum(rate(istio_requests_total{reporter="destination", response_code=~"4.*"}[1m])) / sum(rate(istio_requests_total{reporter="destination"}[1m])) * 100 > 1
  for: 1m
  labels:
    severity: warning
  annotations:
    summary: "Istio high 4xx error rate on clusterID {{ $labels.clusterID }} and region {{ $labels.region }}"
    description: "High percentage of HTTP 4xx responses in Istio (> 1%).\n  VALUE = {{ $value }}\n  LABELS = {{ $labels }}"

- alert: IstioHigh4xxErrorRate5s
  expr: sum(increase(istio_requests_total{reporter="destination", response_code=~"4.*"}[5s])) > 2
  for: 1m
  labels:
    severity: warning
  annotations:
    summary: "Istio high 4xx error rate on clusterID {{ $labels.clusterID }} and region {{ $labels.region }}"
    description: "High percentage of HTTP 4xx responses in Istio (> 2 in 5 seconds).\n  VALUE = {{ $value }}\n  LABELS = {{ $labels }}"

- alert: IstioHigh5xxErrorRate
  expr: sum(rate(istio_requests_total{reporter="destination", response_code=~"5.*"}[1m])) / sum(rate(istio_requests_total{reporter="destination"}[1m])) * 100 > 1
  for: 1m
  labels:
    severity: warning
  annotations:
    summary: "Istio high 5xx error rate on clusterID {{ $labels.clusterID }} and region {{ $labels.region }}"
    description: "High percentage of HTTP 5xx responses in Istio (> 1%).\n  VALUE = {{ $value }}\n  LABELS = {{ $labels }}"

- alert: IstioHigh5xxErrorRate5s
  expr: sum(increase(istio_requests_total{reporter="destination", response_code=~"5.*"}[5s])) > 2
  for: 1m
  labels:
    severity: warning
  annotations:
    summary: "Istio high 5xx error rate on clusterID {{ $labels.clusterID }} and region {{ $labels.region }}"
    description: "High percentage of HTTP 5xx responses in Istio (> 2 in 5 seconds).\n  VALUE = {{ $value }}\n  LABELS = {{ $labels }}"

- alert: IstioRequestTotalHTTP200RateLow
  annotations:
    summary: 'Istio Percentage of HTTP 2xx responses is too low'
    description: "The amount of 2xx responses between {{ $labels.source_app }} and {{ $labels.destination_app }}  is lower than 99.9 percentage. It is too low."
  expr: >
    sum by (destination_app, source_app, instance) (rate(istio_requests_total{response_code=~"2.*"}[1m]))/sum by (destination_app, source_app, instance) (rate(istio_requests_total[1m])) < 0.999

- alert: IstioHighRequestLatency
  expr: rate(istio_request_duration_milliseconds_sum{reporter="destination"}[1m]) / rate(istio_request_duration_milliseconds_count{reporter="destination"}[1m]) > 5s
  for: 1m
  labels:
    severity: warning
  annotations:
    summary: Istio high request latency (instance {{ $labels.instance }} on clusterID {{ $labels.clusterID }} and region {{ $labels.region }})
    description: "Istio average requests execution is longer than 5s.\n  VALUE = {{ $value }}\n  LABELS = {{ $labels }}"

- alert: IstioAbnormalResponseSize
  annotations:
    summary:  "Istio response size is too low"
    descrition:  "Istio responses size between {{ $labels.source_app }} and {{ $labels.destination_app }} is lower than usual for last 5 minutes"
  expr: >
    sum by (destination_app, source_app, instance) (istio_response_bytes_sum offset 5m)/ sum by (destination_app, source_app, instance) (istio_response_bytes_count offset 5m) > 1.5 * sum by (destination_app, source_app, instance)(istio_response_bytes_sum - istio_response_bytes_sum offset 5m)/sum by (destination_app, source_app, instance)(istio_response_bytes_count - istio_response_bytes_count offset 5m)

- alert: IstioLowRequestDuration
  annotations:
    summary: "Istio request duration is too low"
    description: "Istio request duration between {{ $labels.source_app }} and {{ $labels.destination_app }} is lower than usual for last 5 minutes"
  expr: >
  sum by (destination_app, source_app, instance) ( istio_request_duration_milliseconds_sum - istio_request_duration_milliseconds_sum offset 5m )/ sum by (destination_app, source_app, instance) ( istio_request_duration_milliseconds_count - istio_request_duration_milliseconds_count offset 5m)  <  0.3 * sum by (destination_app, source_app, instance) (istio_request_duration_milliseconds_sum offset 5m)/sum by (destination_app, source_app, instance) (istio_request_duration_milliseconds_count offset 5m)
  for: 1m

- alert: IstioHighRequestDuration
  annotations:
    summary: "Istio request duration is too high"
    description: "Istio request duration between {{ $labels.source_app }} and {{ $labels.destination_app }} is higher than usual in last 5 minutes"
  expr: >
  sum by (destination_app, source_app, instance) ( istio_request_duration_milliseconds_sum - istio_request_duration_milliseconds_sum offset 5m )/ sum by (destination_app, source_app, instance) ( istio_request_duration_milliseconds_count - istio_request_duration_milliseconds_count offset 5m) > 2 * sum by (destination_app, source_app, instance) (istio_request_duration_milliseconds_sum offset 5m)/sum by (destination_app, source_app, instance) (istio_request_duration_milliseconds_count offset 5m)
  for: 1m

- alert: IstioHighTotalRequestRate
  expr: sum(rate(istio_requests_total{reporter="destination"}[1m])) > 1000
  for: 1m
  labels:
    severity: warning
  annotations:
    summary: Istio high total request rate (instance {{ $labels.instance }})
    description: "Global request rate in the service mesh is unusually high.\n  VALUE = {{ $value }}\n  LABELS = {{ $labels }}"

- alert: IstioLowTotalRequestRate
  expr: sum(rate(istio_requests_total{reporter="destination"}[1m])) < 10
  for: 1m
  labels:
    severity: warning
  annotations:
    summary: Istio low total request rate (instance {{ $labels.instance }})
    description: "Global request rate in the service mesh is unusually low.\n  VALUE = {{ $value }}\n  LABELS = {{ $labels }}"

- alert: IstioGlobalRequestRateHigh
  annotations:
    summary: 'Istio Global Request Rate High'
    description: 'Istio global request rate is unusually high during the last 1m (current value: *{{ printf "%2.0f%%" $value }}*). The amount of traffic being generated inside the service mesh is higher than normal'
  expr: >
        round(sum(irate(istio_requests_total{reporter="destination"}[1m])), 0.001) > 1000
  for: 1m

- alert: IstioGlobalRequestRateLow
  annotations:
    summary: 'Istio global request rate too low'
    description: 'Istio global request rate is unusually low during the last 1m (current value: *{{ printf "%2.0f%%" $value }}*). The amount of traffic being generated inside the service mesh has dropped below usual levels'
  expr: >
        round(sum(irate(istio_requests_total{reporter="destination"}[1m])), 0.001) < 10
  for: 1m
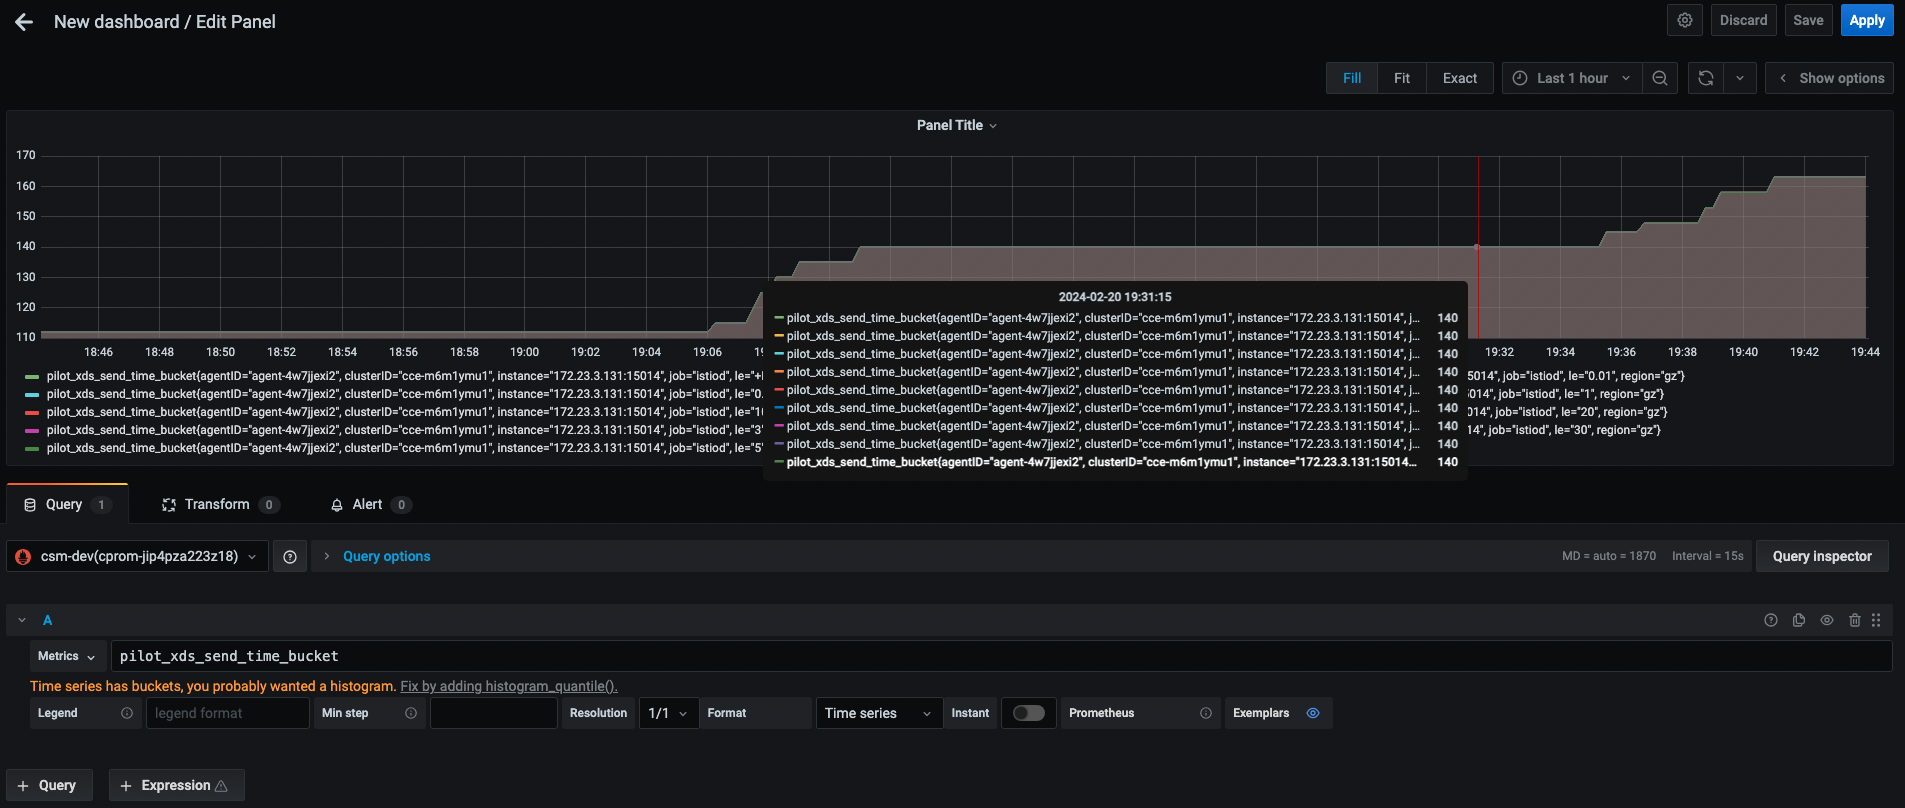
kubectl -n istio-system exec -it istiod-dfdd5ff77-zp7k7  --  curl localhost:15014/metrics | grep pilot_
# HELP pilot_conflict_inbound_listener Number of conflicting inbound listeners.
# TYPE pilot_conflict_inbound_listener gauge
pilot_conflict_inbound_listener 0
# HELP pilot_conflict_outbound_listener_http_over_current_tcp Number of conflicting wildcard http listeners with current wildcard tcp listener.
# TYPE pilot_conflict_outbound_listener_http_over_current_tcp gauge
pilot_conflict_outbound_listener_http_over_current_tcp 0
# HELP pilot_conflict_outbound_listener_tcp_over_current_http Number of conflicting wildcard tcp listeners with current wildcard http listener.
# TYPE pilot_conflict_outbound_listener_tcp_over_current_http gauge
pilot_conflict_outbound_listener_tcp_over_current_http 0
# HELP pilot_conflict_outbound_listener_tcp_over_current_tcp Number of conflicting tcp listeners with current tcp listener.
# TYPE pilot_conflict_outbound_listener_tcp_over_current_tcp gauge
pilot_conflict_outbound_listener_tcp_over_current_tcp 0
# HELP pilot_debounce_time Delay in seconds between the first config enters debouncing and the merged push request is pushed into the push queue.
# TYPE pilot_debounce_time histogram
...
控制平面告警示例如下所示:
# Pilot
- alert: IstioPilotPodNotInEndpointTable
  annotations:
    summary: "Pilot pods not found in the endpoint table"
    description: "Pods not found in the endpoint table, possibly invalid"
  expr: > pilot_no_ip > 0

- alert: IstioPilotEndpointNotReady
  annotations:
    summary: "Pilot endpoint found in unready state"
    description: "Pilot endpoint found in unready state for 30 second"
  expr: > pilot_endpoint_not_ready > 0
  for: 30s

- alert: IstioPilotDestruleSubsetsException
  annotations:
    summary: "Pilot pilot_destrule_subsets is greater than 0"
    description: "pilot_destrule_subsets Duplicate subsets across destination rules for same host"
  expr: > pilot_destrule_subsets > 0

- alert: IstioPilotDuplicateEnvoyClustersException
  annotations:
    summary: "Pilot pilot_duplicate_envoy_clusters is greater than 0"
    description: "pilot_duplicate_envoy_clusters Duplicate envoy clusters caused by service entries with same hostname"
  expr: > pilot_duplicate_envoy_clusters > 0

- alert: IstioPilotDuplicateEntry
  expr: sum(rate(pilot_duplicate_envoy_clusters{}[1m])) > 0
  for: 1m
  labels:
    severity: critical
  annotations:
    summary: Istio Pilot Duplicate Entry on clusterID {{ $labels.clusterID }} and region {{ $labels.region }})
    description: "Istio pilot duplicate entry error.\n  VALUE = {{ $value }}\n  LABELS = {{ $labels }}"

- alert: IstioPilotEndpointNoPodException
  annotations:
    summary: "Pilot endpoint_no_pod is greater than 0"
    description: "endpoint_no_pod Endpoints without an associated pod"
  expr: > endpoint_no_pod > 0

- alert: IstioPilotEdsNoInstancesException
  annotations:
    summary: "Pilot pilot_eds_no_instances is greater than 0"
    description: "pilot_eds_no_instances Number of clusters without instances"
  expr: > pilot_eds_no_instances > 0

- alert: IstioPilotVserviceDupDomainException
  annotations:
    summary: "Pilot pilot_vservice_dup_domain is greater than 0"
    description: "pilot_vservice_dup_domain Virtual services with dup domains"
  expr: > pilot_vservice_dup_domain > 0

# CITADEL
- alert: IstioCitadelRootCertError
  annotations:
    summary: "Citadel root certificate internal error occured"
    description: "Citadel root certificate internal error occured on clusterID {{ $labels.clusterID }} and region {{ $labels.region }}"
  expr: >
    citadel_server_root_cert_expiry_timestamp < 0

- alert: IstioCitadelCertIssuanceFailure
  annotations:
    summary: "Citadel certificate issuance failed"
    description: "Citadel certificate issuance failed in last 1 minutes"
  expr: >
    (citadel_server_csr_count - citadel_server_success_cert_issuance_count) > (citadel_server_csr_count offset 1m - citadel_server_success_cert_issuance_count offset 1m)

- alert: IstioCitadelCsrSignError
  annotations:
    summary: "Citadel CSR signing error"
    description: "Citadel CSR signing error occured in last 1 minutes on clusterID {{ $labels.clusterID }} and region {{ $labels.region }}"
  expr: >
    (absent(citadel_server_csr_sign_err_count offset 1m) == 1 and citadel_server_csr_sign_err_count > 0) or (citadel_server_csr_sign_err_count - citadel_server_csr_sign_err_count offset 1m > 0)

# GALLEY
- alert: IstioGalleyValidationFailed
  annotations:
    summary: "Galley validation failed"
    description: "Galley validation failed in last 1 minutes"
  expr: >
    (absent(galley_validation_failed offset 1m) == 1 and galley_validation_failed > 0) or (galley_validation_failed - galley_validation_failed offset 1m > 0)
模拟触发告警,告警消息示例如下所示:
尊敬的用户:您有一条报警,请登录Prometheus系统查看。
报警合并:策略IstioNo200ResponseCodeRate共产生2个告警事件
告警等级:通知
事件状态:未恢复1个,已恢复1个
告警时段:11-10 16:57:47 - 02-20 16:58:17
告警详情:告警值:0.06666666666666667
告警内容:Detected a high rate of non-200 response codes in Istio within a 5 second window
至此,我们完成了 Prometheus 的告警配置,更多的告警规则,请参考 Promehtues 官方文档。
参考
- https://istio.io/latest/docs/tasks/observability/metrics/
- https://istio.io/latest/docs/ops/configuration/telemetry/envoy-stats/
- https://github.com/openrca/orca/issues/65
- https://samber.github.io/awesome-prometheus-alerts/rules#istio
- https://discuss.istio.io/t/prometheus-alerting-on-istio-components/2167/28