服务网格为微服务提供了一个服务通信的基础设施层,统一为上层的微服务提供了服务发现、负载均衡、重试、熔断等基础通信功能,以及服务路由、灰度发布等高级治理功能。如果我们在使用服务网格系统出现问题的话,我们如何才能快速定位问题以及处理呢?
使用 Istio 过程中遇到的常见问题与解决方法(一)
使用 Istio 过程中遇到的常见问题与解决方法(二)
使用 Istio 过程中遇到的常见问题与解决方法(三)
使用 Istio 过程中遇到的常见问题与解决方法(四)
使用 Istio 过程中遇到的常见问题与解决方法(五)
使用 Istio 过程中遇到的常见问题与解决方法(六)
Istio 常见问题列表
- 在 Istio 中指定 HTTP Header 大小写
- 业务注入 Sidecar 后 pod 处于 CrashLoopBackOff 状态
- Istio Proxy 如何使用 tcpdump 或 iptables
- 开启 Istio Proxy 本地局部限流
- Trace 链路追踪信息不完整
- 调整 istio-proxy 日志级别
- Envoy 默认重试策略导致服务异常
- Envoy 默认熔断不生效
- 长连接导致 Envoy CPU 负载不均衡
- Metrics 导致 Envoy 内存爆炸增长
在 Istio 中指定 HTTP Header 大小写
Envoy 缺省会把 http header 的 key 转换为小写,例如有一个 http header Content-Type: text/html; charset=utf-8,经过 Envoy 代理后会变成 content-type: text/html; charset=utf-8。根据 RFC 2616 规范,在正常情况下,HTTP Header 大小写不会影响结果。
但是在某些情况下,如业务解析 header 依赖大小写、使用的 SDK 对 Header 大小写敏感,上述默认配置会有问题。目前 Envoy 只支持两种规则:全小写(默认使用的规则)、首字母大写(默认没有启用)。我们如何统一 Envoy 中的 Header 小写或者大写呢?。
需要依赖大写 Header 的服务对应的集群中添加规则,将 Header 全部转为首字母大写的形式,如下所示:
# 依赖 istio 1.10+ 版本
apiVersion: networking.istio.io/v1alpha3
kind: EnvoyFilter
metadata:
  name: http-header-proper-case-words
  namespace: istio-system
spec:
  configPatches:
  # 配置保留 upstream 的 request header 大小写
  - applyTo: CLUSTER
    patch:
      operation: MERGE
      value:
        typed_extension_protocol_options:
          Envoy.extensions.upstreams.http.v3.HttpProtocolOptions:
            '@type': type.googleapis.com/Envoy.extensions.upstreams.http.v3.HttpProtocolOptions
            use_downstream_protocol_config:
              http_protocol_options:
                header_key_format:
                  stateful_formatter:
                    name: preserve_case
                    typed_config:
                      '@type': type.googleapis.com/Envoy.extensions.http.header_formatters.preserve_case.v3.PreserveCaseFormatterConfig
  # 配置保留收到的 response header 大小写
  - applyTo: NETWORK_FILTER
    match:
      listener:
        filterChain:
          filter:
            name: Envoy.filters.network.http_connection_manager
    patch:
      operation: MERGE
      value:
        typed_config:
          '@type': type.googleapis.com/Envoy.extensions.filters.network.http_connection_manager.v3.HttpConnectionManager
          http_protocol_options:
            header_key_format:
              stateful_formatter:
                name: preserve_case
                typed_config:
                  '@type': type.googleapis.com/Envoy.extensions.http.header_formatters.preserve_case.v3.PreserveCaseFormatterConfig
部署上述配置前,Header 的响应如下所示:
HTTP/1.1 200 OK
content-type: text/html; charset=utf-8
content-length: 1683
date: Mon, 25 Sep 2023 05:48:46 GMT
x-Envoy-upstream-service-time: 6
部署上述配置后,Header 的响应如下所示:
HTTP/1.1 200 OK
Content-Type: text/html; charset=utf-8
Content-Length: 1683
Date: Mon, 25 Sep 2023 05:44:35 GMT
x-Envoy-upstream-service-time: 6
如果希望 Envoy 对某些请求开启 Header 首字母大写的规则,可以用以下 EnvoyFilter:
apiVersion: networking.istio.io/v1alpha3
kind: EnvoyFilter
metadata:
  name: http-header-proper-case-words
  namespace: istio-system
spec:
  configPatches:
  - applyTo: NETWORK_FILTER
    match:
      # context omitted so that this applies to both sidecars and gateways
      listener:
        name: XXX # 指定 cos 使用的 listener name,可以从 config_dump 中查询到
        filterChain:
          filter:
            name: "envoy.http_connection_manager"
    patch:
      operation: MERGE
      value:
        name: "envoy.http_connection_manager"
        typed_config:
          "@type": "type.googleapis.com/envoy.config.filter.network.http_connection_manager.v2.HttpConnectionManager"
          http_protocol_options:
            header_key_format:
              proper_case_words: {}
如果希望直接全局开启 Header 首字母大写的规则,可以使用以下 EnvoyFileter:
apiVersion: networking.istio.io/v1alpha3
kind: EnvoyFilter
metadata:
 name: http-header-proper-case-words
 namespace: istio-system
spec:
  configPatches:
  - applyTo: NETWORK_FILTER
    match:
      listener:
        filterChain:
          filter:
            name: "envoy.filters.network.http_connection_manager"
    patch:
      operation: MERGE
      value:
        typed_config:
          "@type": "type.googleapis.com/envoy.extensions.filters.network.http_connection_manager.v3.HttpConnectionManager"
          http_protocol_options:
            header_key_format:
              stateful_formatter:
                name: preserve_case
                typed_config:
                  "@type": type.googleapis.com/envoy.extensions.http.header_formatters.preserve_case.v3.PreserveCaseFormatterConfig
最佳实践:应用程序应遵循 RFC 2616 规范,对 Http Header 的处理采用大小写不敏感的原则。有关更多详细的信息可参考Envoy config-http-conn-man-header-casing。
业务注入 Sidecar 后 pod 处于 CrashLoopBackOff 状态
现象:业务注入 Sidecar 后,Istio Proxy 一直处于 CrashLoopBackOff 状态,查看 istio-proxy 容器,发现启动失败。
查看 istio-init 容器的日志,报错日志如下所示:
error Command error output: xtables parameter problem: iptables-restore:
unable to initialize table 'nat' Error occurred at line: 1
Try `iptables-restore -h' or 'iptables-restore --help' for more information.
2023-09-21T03:33:15.489511Z error Failed to execute: iptables-restore --noflush /tmp/iptables-rules-1695267195488162269.txt828466854, exit status 2
出现上述现象的原因是 Kubernetes Pod 所在的 Node 节点上内核缺少 iptables 模块,内核模块要求如下所示:
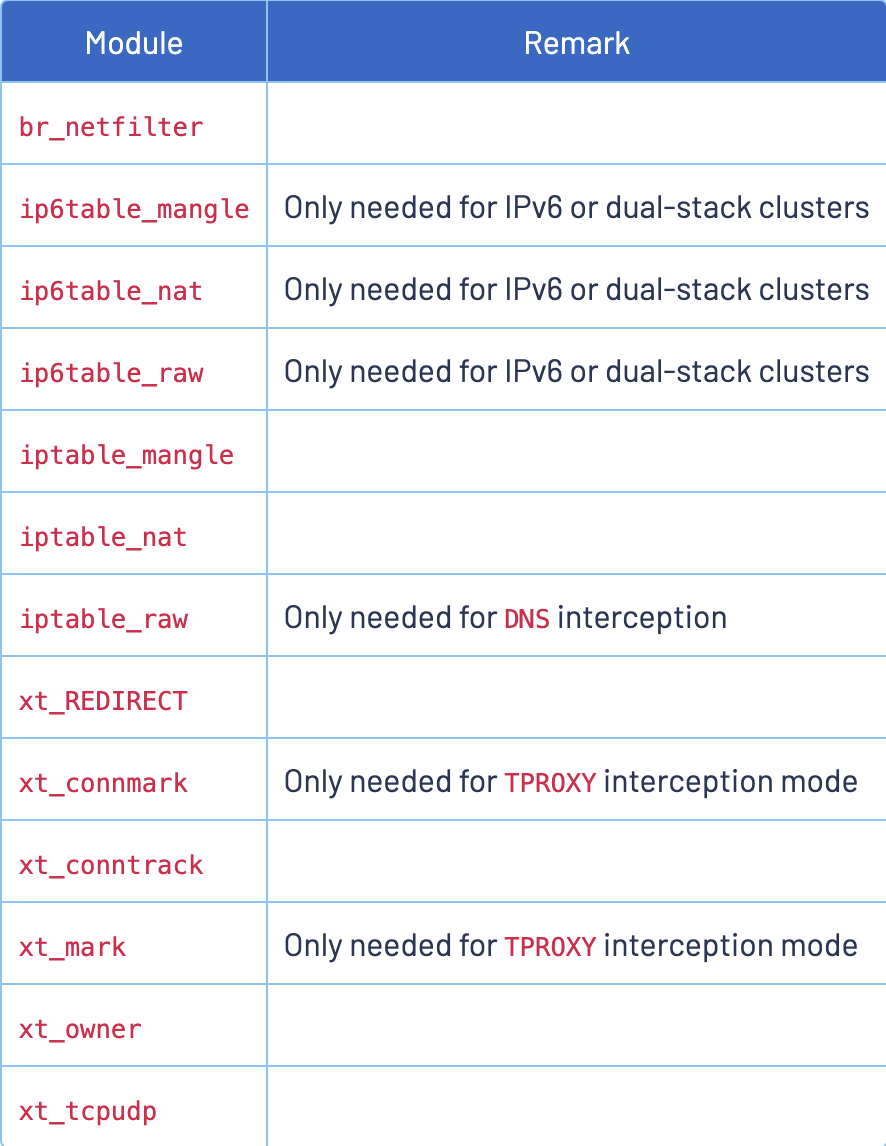
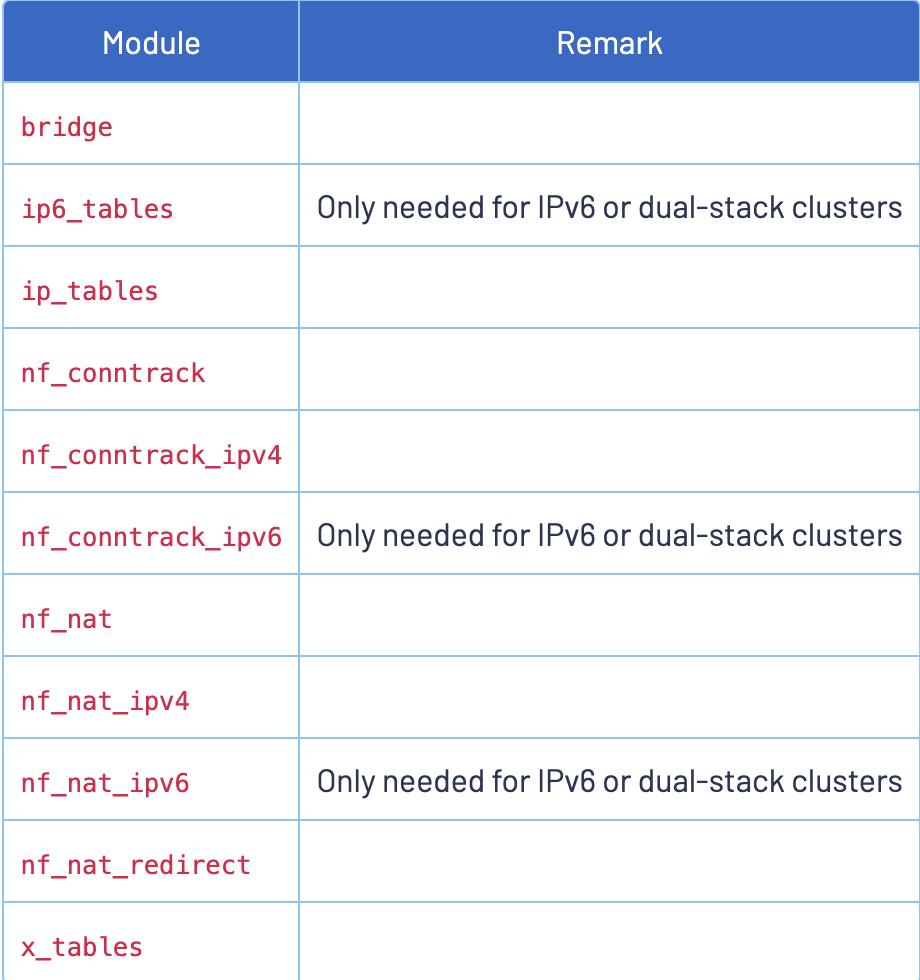
具体详细信息可参考:istio prerequisites。
解决方式:因为 istio-proxy 劫持流量需要使用 iptables,所以我们需要 Kubernetes Node 节点满足上述 istio prerequisites 条件。参考类似的 issue。
解决方式1:istio 安装开启 cni 插件:
--set components.cni.enabled=true
解决方式2:centos8 及一些红帽系 Linux 使用 iptables-nftables,不使用 iptables。Istio 通过使用 iptables 添加 nat 规则来拦截流量,Linux 应该启用 netfix linux 内核模块。
永久生效(重启机器):
cat >/etc/modules-load.d/99-istio-modules.conf <<EOF
br_netfilter
nf_nat
nf_nat_redirect
xt_REDIRECT
xt_owner
iptable_nat
iptable_mangle
iptable_filter
EOF

# 重启 node 机器
reboot
临时生效(不重启机器),机器重启后失效。
modprobe br_netfilter
modprobe nf_nat
modprobe nf_nat_redirect
modprobe xt_REDIRECT
modprobe xt_owner
modprobe iptable_nat
modprobe iptable_mangle
modprobe iptable_filter
Istio Proxy 如何使用 tcpdump 或 iptables
现象:在 Kubernetes 集群中,Istio 通过 sidecar 模式将 Envoy 代理注入到每个 Pod 中,所有的入站和出站流量都会经过这个代理。
当流量访问不通或者需要抓取 istio-proxy 中的网络包时,我们需要在容器中执行 iptables 或 tcpdump 命令,但是会遇到以下类似错误:
istio-proxy@ratings-v1-85cc46b6d4-bsg94:/$ iptables -t nat -L
Fatal: can't open lock file /run/xtables.lock: Read-only file system

istio-proxy@ratings-v1-85cc46b6d4-bsg94:/$ sudo iptables -t nat -L
sudo: The "no new privileges" flag is set, which prevents sudo from running as root.
sudo: If sudo is running in a container, you may need to adjust the container configuration to disable the flag.

istio-proxy@ratings-v1-85cc46b6d4-bsg94:/$ tcpdump
tcpdump: eth0: You don't have permission to capture on that device
(socket: Operation not permitted)
istio-proxy@ratings-v1-85cc46b6d4-bsg94:/$ sudo tcpdump
sudo: The "no new privileges" flag is set, which prevents sudo from running as root.
sudo: If sudo is running in a container, you may need to adjust the container configuration to disable the flag.
解决方式:
方式1:我们需要给 istio 开启特权模式,并且需要给应用加上 sidecar.istio.io/enableCoreDump: true 注解,如下所示:
应用添加 annotations 注解 sidecar.istio.io/enableCoreDump: "true"。
apiVersion: apps/v1
kind: Deployment
metadata:
  name: sleep
spec:
  replicas: 1
  selector:
    matchLabels:
      app: sleep
  template:
    metadata:
      annotations:
        sidecar.istio.io/enableCoreDump: "true" # 注解
      labels:
        app: sleep
  ...
istio-system 命名空间下的 configmap istio-sidecar-injector 设置 privileged 为 true。(需要 Pod 重启重新注入 Sidecar 才会生效)。
values: |-
    {
      "global": {
         "proxy": {
            "image": "proxyv2",
            "includeIPRanges": "*",
            "includeInboundPorts": "*",
            "includeOutboundPorts": "",
            "logLevel": "warning",
            "privileged": true,   # 特权模式
            "readinessFailureThreshold": 30,
            "readinessInitialDelaySeconds": 1,
            "readinessPeriodSeconds": 2,
         }
      }
    }
方式2:安装 Istio 时就开启特权模式与 sidecar.istio.io/enableCoreDump,安装 Istio 命令如下所示:
istioctl install --set values.global.proxy.privileged=true --set values.global.proxy.enableCoreDump=true --set profile=demo
其中,values.global.proxy.privileged=true 对应上面的特权模式,values.global.proxy.enableCoreDump=true 对应上面的只读权限。更多的详细细心可参考 https://github.com/istio/istio/issues/37769。
方式3:使用 node 调试工具进入 Pod 所在的 Node 节点,使用 sudo nsenter -t $PID_OF_SIDECAR_Envoy -n tcpdump 或者 sudo nsenter -t $PID_OF_SIDECAR_Envoy -n 。
使用 tcpdump 抓取 istio-proxy 中的网络数据包时,有以下命令可以参考。
export ETH0_IP=$(ip addr show eth0 | grep "inet\b" | awk '{print $2}' | cut -d/ -f1)
export LOCAL_IP=$(ip addr show lo | grep "inet\b" | awk '{print $2}' | cut -d/ -f1)

# inbound mTLS
sudo tcpdump -i eth0 -n -vvvv  "(dst port 8080 and dst $ETH0_IP) or (src port 8080 and src $ETH0_IP)"
# inbound 明文
sudo tcpdump -i any -n -vvvv -A "(dst port 8080 and dst $ETH0_IP) or (src port 8080 and src $ETH0_IP)"

# outbound 明文
sudo tcpdump -i any -n -vvvv -A  "((dst port 15001 and dst 127.0.0.1) or (dst portrange 20000-65535 and dst $ETH0_IP))"
# outbound mTLS
sudo tcpdump -i eth0 -n -vvvv -A  "((src portrange 20000-65535 and src $ETH0_IP) or (dst portrange 20000-65535 and dst $ETH0_IP))"

# mtls 加密报文
sudo tcpdump -ni eth0 "tcp port 8500 and (tcp[((tcp[12] & 0xf0) >> 2)] = 0x16)
开启 Istio Proxy 本地局部限流
限流中的相关概念,Domain: domain 是一组限流的容器,限流服务所有的 domain 必须是全局唯一的。Descriptor: Descriptor(描述符)是 Domain 拥有的 key/val 列表,限流服务使用它来选择是否进行限流。每一个配置都会包含一个 Descriptor 并且区分大小写和支持嵌套。tcp 限流 ratelimit 过滤器创建在 listener,Envoy 为每个连接调用 ratelimit 限流服务,这样能限制每秒该 listener 上建立的连接数。http 级别限流,ratelimit 过滤器创建在 router,既可以限制到目标 upstream cluster 的所有请求速率,也可以限制不同来源的到目标 upstream cluster 的请求限流。
当请求的路由或者虚拟主机各自具有过滤器的"本地限流配置"时,http 本地限流过滤器将使用令牌桶限流,服务限流是实例级别限流,这就意味着会为每一个 pod 开启限流,如果存在限流规则每分钟允许 100 个请求,并且存在 3 个 pod 副本,实际测试 1 分钟内则需要发起 300 个请求才可以触发限流。
下面我们就以本地限流举例,探讨如何使用 Envoyfilter 给 istio proxy 开启本地限流:
apiVersion: networking.istio.io/v1alpha3
kind: EnvoyFilter
metadata:
  name: filter-local-ratelimit-svc
  namespace: istio-system
spec:
  workloadSelector:
    labels:
      app: productpage
  configPatches:
    - applyTo: HTTP_FILTER
      match:
        context: SIDECAR_INBOUND
        listener:
          filterChain:
            filter:
              name: "Envoy.filters.network.http_connection_manager"
      patch:
        operation: INSERT_BEFORE
        value:
          name: Envoy.filters.http.local_ratelimit
          typed_config:
            "@type": type.googleapis.com/udpa.type.v1.TypedStruct
            type_url: type.googleapis.com/Envoy.extensions.filters.http.local_ratelimit.v3.LocalRateLimit
            value:
              stat_prefix: http_local_rate_limiter
              token_bucket:
                max_tokens: 10
                tokens_per_fill: 10
                fill_interval: 60s
              filter_enabled:
                runtime_key: local_rate_limit_enabled
                default_value:
                  numerator: 100
                  denominator: HUNDRED
              filter_enforced:
                runtime_key: local_rate_limit_enforced
                default_value:
                  numerator: 100
                  denominator: HUNDRED
              response_headers_to_add:
                - append: false
                  header:
                    key: x-local-rate-limit
                    value: 'true'
配置上述 Envoyfilter,productpage 实例允许通过的 req/min 不超过 10 次,超过 10 次会触发 429 限流,结果如下所示:
➜  learn kubectl exec "$(kubectl get pod -l app=ratings -o jsonpath='{.items[0].metadata.name}')" -c ratings -- curl -s productpage:9080/productpage -o /dev/null -w "%{http_code}\n"
200
➜  learn kubectl exec "$(kubectl get pod -l app=ratings -o jsonpath='{.items[0].metadata.name}')" -c ratings -- curl -s productpage:9080/productpage -o /dev/null -w "%{http_code}\n"
429
Trace 链路追踪信息不完整
现象:通过 UI 展示的 Trace 链路追踪显示不完整,缺失上下游的链路调用关系。
istio 要使用 trace 链路追踪,并不是说业务完全无侵入,需要业务收到 tracing 相关的 header 后要将其传递给下一个被调用服务。该步骤是无法让 istio 实现的,因为 istio 不知道业务中调用其它服务的请求到底是该对应前面哪个请求,所以需要业务来传递 header,最终才能将链路完整串起来。
原因:绝大多数情况下都是因为业务没将 tracing 所需要的 http header 正确传递或根本没有传递。
bookinfo 案例中的 reviews 服务会调用 ratings 服务,其中传递 header 的代码如下所示:
// HTTP headers to propagate for distributed tracing are documented at
// https://istio.io/docs/tasks/telemetry/distributed-tracing/overview/#trace-context-propagation
private final static String[] headers_to_propagate = {
    // All applications should propagate x-request-id. This header is
    // included in access log statements and is used for consistent trace
    // sampling and log sampling decisions in Istio.
    "x-request-id",

    // Lightstep tracing header. Propagate this if you use lightstep tracing
    // in Istio (see
    // https://istio.io/latest/docs/tasks/observability/distributed-tracing/lightstep/)
    // Note: this should probably be changed to use B3 or W3C TRACE_CONTEXT.
    // Lightstep recommends using B3 or TRACE_CONTEXT and most application
    // libraries from lightstep do not support x-ot-span-context.
    "x-ot-span-context",

    // Datadog tracing header. Propagate these headers if you use Datadog
    // tracing.
    "x-datadog-trace-id",
    "x-datadog-parent-id",
    "x-datadog-sampling-priority",

    // W3C Trace Context. Compatible with OpenCensusAgent and Stackdriver Istio
    // configurations.
    "traceparent",
    "tracestate",

    // Cloud trace context. Compatible with OpenCensusAgent and Stackdriver Istio
    // configurations.
    "x-cloud-trace-context",

    // Grpc binary trace context. Compatible with OpenCensusAgent nad
    // Stackdriver Istio configurations.
    "grpc-trace-bin",

    // b3 trace headers. Compatible with Zipkin, OpenCensusAgent, and
    // Stackdriver Istio configurations. Commented out since they are
    // propagated by the OpenTracing tracer above.
    "x-b3-traceid",
    "x-b3-spanid",
    "x-b3-parentspanid",
    "x-b3-sampled",
    "x-b3-flags",

    // SkyWalking trace headers.
    "sw8",

    // Application-specific headers to forward.
    "end-user",
    "user-agent",

    // Context and session specific headers
    "cookie",
    "authorization",
    "jwt",
};

private JsonObject getRatings(String productId, HttpHeaders requestHeaders) {
  ClientBuilder cb = ClientBuilder.newBuilder();
  Integer timeout = star_color.equals("black") ? 10000 : 2500;
  cb.property("com.ibm.ws.jaxrs.client.connection.timeout", timeout);
  cb.property("com.ibm.ws.jaxrs.client.receive.timeout", timeout);
  Client client = cb.build();
  WebTarget ratingsTarget = client.target(ratings_service + "/" + productId);
  Invocation.Builder builder = ratingsTarget.request(MediaType.APPLICATION_JSON);
  for (String header : headers_to_propagate) {
    String value = requestHeaders.getHeaderString(header);
    if (value != null) {
      builder.header(header,value);
    }
  }
  ...
}
解决方式:在业务中正确地传递 trace 链路追踪中所需要的 header。
调整 istio-proxy 日志级别
在 istio 中如何自定义数据面 (proxy) 的日志级别,方便我们排查问题时进行调试。 调低 proxy 日志级别进行 debug 有助于排查问题,但输出内容较多且耗资源,不建议在生产环境开启。
istioctl:istio 提供的 istioctl 工具。
# 全局设置日志格式
istioctl -n test proxy-config log productpage-v1-xxx --level debug
# 细粒度设置日志格式
istioctl -n test proxy-config log productpage-v1-xxx --level grpc:trace,lua:debug
更多 level 可选项参考: istioctl proxy-config log --help。
Pilot Agent HTTP 接口:如果没有 istioctl,直接使用 kubectl 进入 istio-proxy 容器调用 Envoy HTTP 接口来动态调整日志级别:
usage: /logging?<name>=<level> (change single level)
usage: /logging?paths=name1:level1,name2:level2,... (change multiple levels)
usage: /logging?level=<level> (change all levels)
levels: trace debug info warning error critical off

# HTTP 接口
kubectl exec -n test productpage-v1-xxx -c istio-proxy -- curl -XPOST http://localhost:15000/logging?level=debug

# 细粒度 HTTP 接口
kubectl exec -n test productpage-v1-xxx -c istio-proxy -- curl -XPOST http://localhost:15000/logging?paths=grpc:trace,lua:debug
使用 annotation 注解:在部署 Pod(业务) 时配置 annotation 来指定 proxy 日志级别,Yaml 如下所示:
template:
  metadata:
    annotations:
      "sidecar.istio.io/logLevel": debug # 可选: trace, debug, info, warning, error, critical, off
如何细粒度的调整 Envoy 日志级别呢?可以给 Pod(业务) 指定 annotation 来配置,如下所示:
template:
  metadata:
    annotations:
      "sidecar.istio.io/componentLogLevel": "ext_authz:trace,lua:debug"
该配置最终会作为 Envoy 的 --component-log-level 启动参数,更多的详细信息可参见 component-log-level。
全局配置:可以全局配置 proxy 日志级别(测试集群使用,生产集群不推荐使用),修改 values 里面的 global.proxy.logLevel 字段即可。
kubectl -n istio-system edit configmap istio-sidecar-injector
如果使用 istioctl 安装 istio,使用类似以下命令配置全局 proxy 日志级别:
istioctl install --set profile=demo --set values.global.proxy.logLevel=debug
Envoy 默认重试策略导致服务异常
现象:Istio Proxy 默认的重试策略可能会在某些情况下导致服务异常。例如,如果服务在处理请求时出现暂时性的问题,Istio Proxy 会尝试重新发送请求。然而,如果问题是由于服务本身的错误(如代码错误或配置问题)导致的,那么重试请求只会导致更多的错误,并可能使问题变得更糟。Istio 为 Envoy 设置了缺省的重试策略,会在 connect-failure, refused-stream, unavailable, cancelled, retriable-status-codes 等情况下重试两次。出现上述错误时,可能已经触发了服务器逻辑,如果操作不是幂等(任意多次执行所产生的影响均与一次执行的影响相同)的情况下,可能会导致错误。
关闭重试:我们可以通过如下 VirtualService CRD 关闭 Proxy 的默认重试功能,如下所示:
apiVersion: networking.istio.io/v1alpha3
kind: VirtualService
metadata:
  name: productpage-vs
spec:
  hosts:
  - productpage.default.svc.cluster.local
  http:
  - retries:
      attempts: 0
自定义重试策略:我们也可以自定义重试策略,将重试次数设置为 2,重试超时时间设置为 2 秒,如下所示:
apiVersion: networking.istio.io/v1alpha3
kind: VirtualService
metadata:
  name: productpage-vs
spec:
  hosts:
  - productpage.default.svc.cluster.local
  http:
  - route:
    - destination:
        host: productpage.default.svc.cluster.local
    retries:
      attempts: 2
      perTryTimeout: 2s
在这个配置中,retries 字段定义了重试策略,attempts 字段定义了最大重试次数,perTryTimeout 字段定义了每次重试的超时时间。
有关 Envoy 自动重试的 Metric upstream_cx_connect_attempts_exceeded 指标,如下所示:
# upstream_cx_connect_attempts_exceeded, Counter, Total consecutive connection failures exceeding configured connection attempts
istio-proxy@productpage-v1-66756cddfd-629hp:/$ curl localhost:15000/stats/prometheus | grep attempts
  % Total    % Received % Xferd  Average Speed   Time    Time     Time  Current
                                 Dload  Upload   Total   Spent    Left  Speed
  0     0    0     0    0     0      0      0 --:--:-- --:--:-- --:--:--     0# TYPE Envoy_cluster_upstream_cx_connect_attempts_exceeded counter
Envoy_cluster_upstream_cx_connect_attempts_exceeded{cluster_name="xds-grpc"} 0
100  392k    0  392k    0     0  92.2M      0 --:--:-- --:--:-- --:--:-- 95.9M
Envoy 默认熔断不生效
现象:给服务配置了 DestinationRule 限流熔断策略,但是没有生效,其中 DestinationRule 文件如下所示:
apiVersion: networking.istio.io/v1beta1
kind: DestinationRule
metadata:
  name: productpage-dr
spec:
  host: productpage.default.svc.cluster.local
  trafficPolicy:
    connectionPool:
      tcp:
        maxConnections: 1
当并发超过最大连接数 1 时,并没有触发熔断,只是 QPS 很低。是因为没有配置 http1MaxPendingRequests,默认值为 2^32-1,非常大。如果超过最大连接数,请求就先等待(不直接返回 503),当连接数低于最大值时再继续转发。如果希望连接达到上限或超过上限一定量后直接熔断(响应 503),就需要显式指定 http1MaxPendingRequests 值。
解决方式:显示指定 http1MaxPendingRequests 值,文件如下所示:
apiVersion: networking.istio.io/v1beta1
kind: DestinationRule
metadata:
  name: productpage-dr
spec:
  host: productpage.default.svc.cluster.local
  trafficPolicy:
    connectionPool:
      tcp:
        maxConnections: 1
      http:
        http1MaxPendingRequests: 1
长连接导致 Envoy CPU 负载不均衡
现象:Envoy 进程占用的 CPU 不均衡。Ingress Gateway Pod 一共有 16 个 worker,但部分 worker 的 CPU 使用率较高,其他 CPU 使用率很低,出现该问题后,虽然很多的 CPU 还是空闲的,但会由于 Envoy 的处理能力不足而导致请求积压,请求时延变长,甚至请求超时。如下所示:
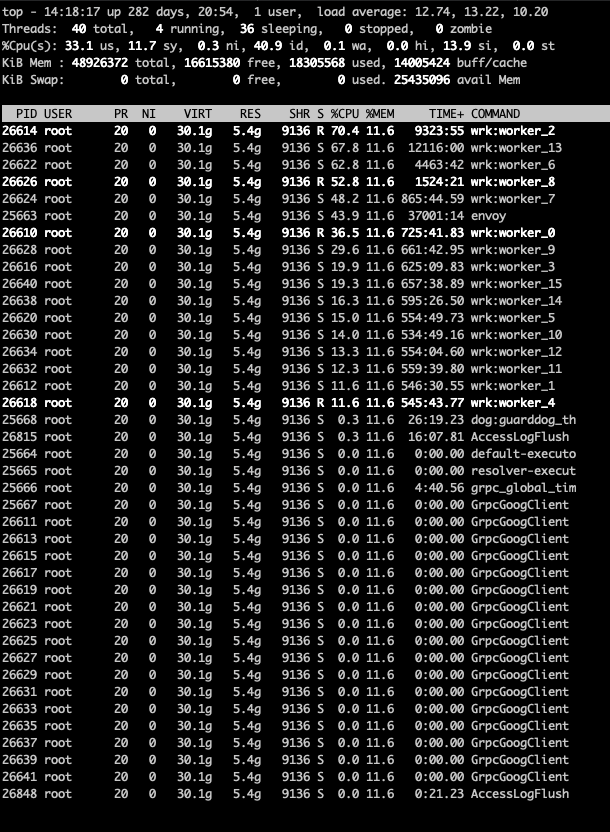
基于上述现象,分析问题原因,具体原因还是要回归到 Envoy 的线程模型:
主进程 Envoy,多个 woker 线程,woker 线程负责处理请求,worker 线程的数量目前建议和 cpu 的数量一致,每个 worker 对应一个 cpu,当一个 TCP 连接被分配到一个 worker 线程处理后,该连接的整个生命周期的处理都是在同一个 worker 线程处理。
为何要绑定连接到线程?在 Envoy 内部,连接是有状态数据的,特别是对于 HTTP 的连接。为减少线程间共享数据的锁争用,同时也为提高 CPU cache 的命中率,Envoy 采用了这种绑定的设计。
原因1: 当一个 worker 有较多的阻塞 TCP 长连接,那么长连接阻塞的数据会占用很多 CPU 资源,然后导致分配到该 worker 的其他短连接请求的处理产生影响,延时变大。
原因2:目前 Envoy 的线程模型不能保证 tcp 连接在所有的 worker 中均衡分配。
如何让 TCP 连接在 Envoy 的不同 worker 之间更加均衡的分布,有两种方案:
- 借用 Linux 系统的
SO_REUSEPORT特性,设置reuseport,可参考记一次 Istio 调优 Part 2 —— 饥饿的线程与 SO_REUSEPORT。 - 给 Envoy 设置 listener 选项
connection_balance_config为exact_balance可以实现 TCP 连接的精确分配,但是会引入锁的性能开销,对于频繁建立新连接的系统影响较大。
解决方式1:Envoy 在 listener 的配置中提供了一个 connection_balance_config 选项来强制在多个 worker 线程之间对连接进行均匀分配。对于大量长连接,可以使用 EnvoyFilter 来启用 connection_balance_config。为 Ingress Gateway 启用 worker 连接均衡功能,如下所示:
apiVersion: networking.istio.io/v1alpha3
kind: EnvoyFilter
metadata:
  name: ingress-Envoy-listener-balance
  namespace: istio-system
spec:
  workloadSelector:
    labels:
      istio: ingressgateway
  configPatches:
  - applyTo: LISTENER
    match:
      context: GATEWAY
    patch:
      operation: MERGE
      value:
        connection_balance_config:
          exact_balance: {}
解决方式2:开启 reuseport 特性。打开 Envoy 的 stats 统计数据,如下所示:
apiVersion: v1
kind: Pod
metadata:
  name: fortio
  annotations:
    proxy.istio.io/config: |-
      proxyStatsMatcher:
        inclusionRegexps:
        - ".*_cx_.*"
以 virtualOutbound 为例,开启 reuse_port,所使用的参考示例如下所示:
apiVersion: networking.istio.io/v1alpha3
kind: EnvoyFilter
metadata:
  name: my_reuse_port_envoyfilter
spec:
  workloadSelector:
    labels:
      app: productpage
  configPatches:
    - applyTo: LISTENER
      match:
        context: SIDECAR_OUTBOUND
        listener:
          portNumber: 15001
          name: "virtualOutbound"
      patch:
        operation: MERGE
        value:
          reuse_port: true
说明:
- 如果一个 Listener 通过设置
use_original_dst将所有连接都交给其他 Listener 处理,则建议不要在该 Listener 上设置connection_balance_config,以避免在该 Listener 上引入额外的开销。这种情况下,应该在真正处理连接的 Listener 上设置该选项,参见 Envoy 文档。 - 如果需要绝对平均分配连接,可以试试 Listener 的配置
connection_balance_config: exact_balance,由于有锁,对高频新连接应该有一定的性能损耗。
总结:当长连接压力客户端启动之后,异常慢请求开始出现,数量开始时迅速增加,往后逐渐减少到趋于稳定。从耗时来看,upstream_lantency 的时间始终都很短,在几十毫秒以内,说明上游后端服务的处理时间很短,但是 new_total_latency 总耗时部分请求时延明显增加,并且耗时分布不均匀,几百毫秒到十几秒都有。缺省情况下,Envoy 不会在多个 worker 线程之间对连接数量进行均衡。在大部分 upstream 连接都是短连接的情况下,操作系统可以很好地将连接比较均匀地分配到多个 worker 线程上。但是,在长连接的情况下(例如 HTTP2/GRPC),多个 worker 线程分配到的连接数量可能不够均匀,就会出现有的 CPU 使用率高,有的 CPU 使用率低的现象。
Metrics 导致 Envoy 内存爆炸增长
现象:业务给 Pod 配置了遥测 Telemetry CRD 后,Envoy 内存迅速增长,不久后内存溢出,导致 Pod 不断重启。Telemetry CRD 如下所示:
apiVersion: telemetry.istio.io/v1alpha1
kind: Telemetry
metadata:
  name: request-path-metrics
  namespace: test
spec:
  selector:
    matchLabels:
      app: demo
  metrics:
  - providers:
    - name: prometheus
    overrides:
    - tagOverrides:
        request_path:
          value: "request.path"
        request_url_path:
          value: "request.url_path"
上述 CRD 表示 Istio 将收集一些自定义的度量指标,并将这些指标发送给 Prometheus。这些度量指标将包含 request_path 和 request_url_path 这两个自定义的标签,它们的值分别是请求的路径和 URL 路径。配置上述 CRD 后,istio_requests_total 指标会增加字段,示例如下所示:
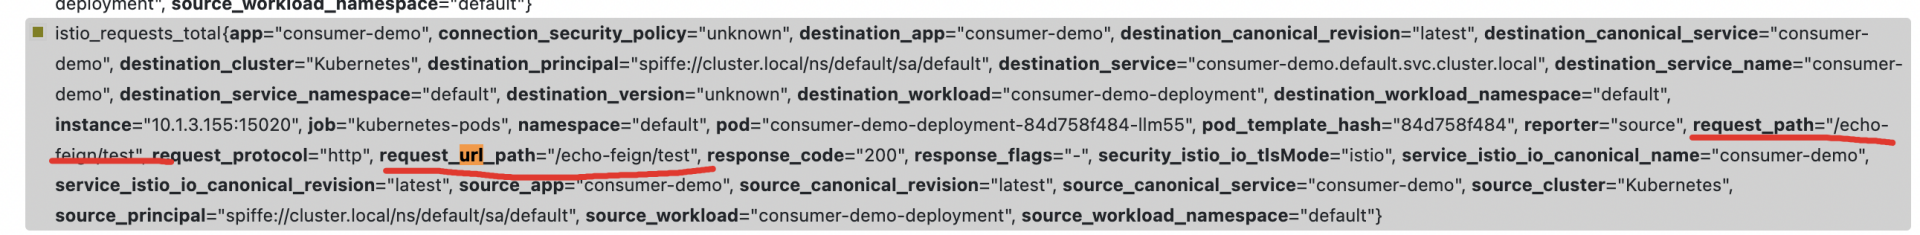
原因:Istio Telemetry CRD 提供了 request_path:request.path 选项,该配置表示在 metrics 中新增一个 tag,取值为 HTTP 请求 Header 中的 path 字段。由于该服务请求中 path 字段包含了用户 header 等变量,导致 Metrics 的取值范围很广,进而导致 envoy 中的 metrics 实例数量暴增,最终导致内存溢出。
测试结果:在配置 request_path 后,内存占用情况与基准对比。
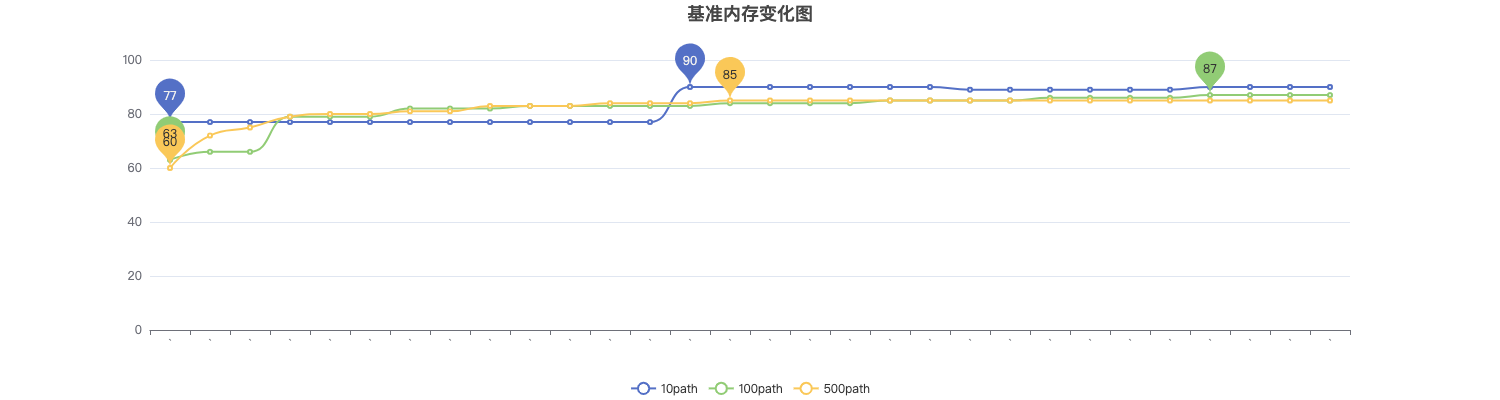
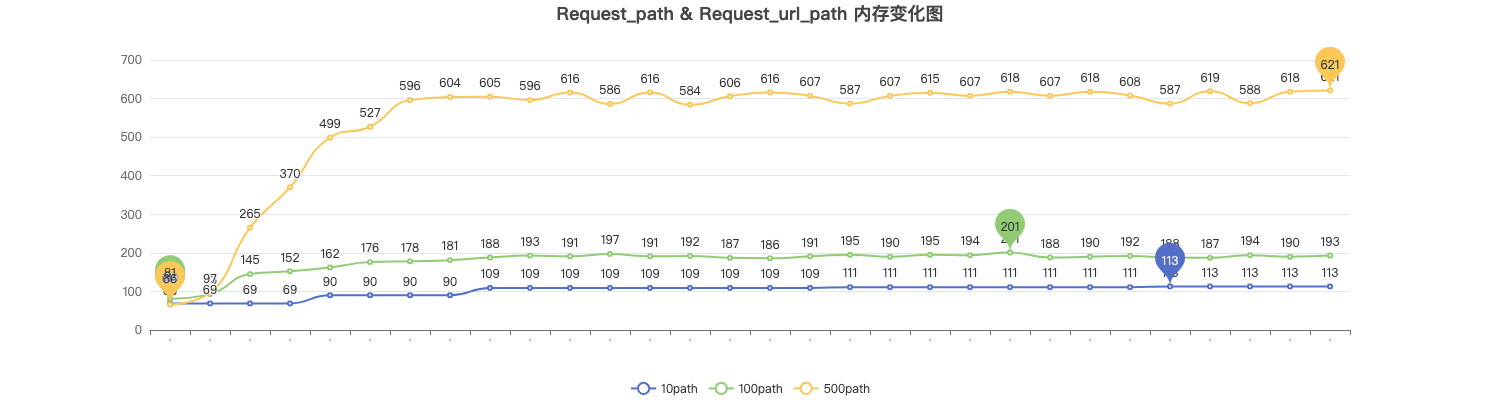
- 10 个路径的情况下内存占是基准的 1 倍多;
- 100 个路径的情况下内存占用是基准的 2 到 3 倍;
- 500 个路径的情况下内存占用是基准的 7 到 8 倍;
解决方式:
在 Telemetry CRD 中去除 header tag 后,该问题即可得到解决。为 istio 数据面 metrics 增加 tag 时需要特别注意,不要随意加入取值范围较大,特别是取值为离散值的 tag,这会导致 metrics 占用的内存数量成倍增长。